Recently I had to develop a report where column names had to have text in vertical direction. There have been enhancements made in Sql server 2008 R2 called Rotating Text 270 degrees. Currently working on SQL Server 2008, this option is not there. In order to make the Column header text vertical, I had to set a property on the column textbox called WritingMode and set it to Vertical. Once this was done I got the column header to show up in a vertical fashion. The other requirement was to center the text. Initially I set the following properties of the textbox:
They were TextAlign set to Center, The VerticalAlign was set to Middle. I ran the report after the properties were set and still the column text was not perfectly centered. After playing around with the different properties, I set the Property CanGrow to false. Once this was done, i got the text to center in the column textbox. Interesting this took a while set it right, at first sight it seemed very easy requirement. In summary the following properties were set:
WritingMode Vertical
VerticalAlign Middle
TextAlign Center
CanGrow False.
Wednesday, July 28, 2010
Tuesday, July 27, 2010
Page Breaks in SSRS...
I am posting this link in response to one of the reader's (sumit's) comment about on how to assign a Page break after a specific number of rows. The requirement is interesting since normally page breaks are based on groups and these are usually set at the Group level. The following link talks about dynamic grouping in great detail. There are very interesting ways suggested to achive this result.
http://www.spacefold.com/lisa/post/2009/03/08/Dynamic-Page-Breaks-in-SSRS-Going-to-Eleven.aspx.
I have not run into this situation before, apparently from the above link, there other reporting tools which offer conditional pagebreaks....
Also this is taken form the MSDN forumns:
BOL 2008:
Page Breaks
In some reports, you may want to place a page break at the end of a specified number of rows instead of, or in addition to, on groups or report items. To do this, create a group in a data region (typically a group immediately outside the detail), add a page break to the group, and then add a group expression to group by a specified number of rows.
The following expression, when placed in the group expression, assigns a number to each set of 25 rows. When a page break is defined for the group, this expression results in a page break every 25 rows.
=Int((RowNumber(Nothing)-1)/25)
Wednesday, July 21, 2010
Export to Excel - SSRS
As a Follow-up to my previous post on exporting reports to Excel. There are 2 ways to export a SSRS report to excel. The first way is to use the dropdown provided for export in the Report Viewer: When you choose the following option below, the excel export retains the formatting of the data provided in the SSRS report.

There is a second option on how to export to excel. This happens when you right click on the report and then you have the pop up menu which comes in the IE browser, there is an option to export to excel here. When you choose this option, only the data in the SSRS report is exported, it loses the custom formatting. It is in this option that one tends to start seeing blank columns when you have the interactive sort turned on the columns in the report. I should have been more explicit when i blogged about the excel export option in my previous post. Here is the image for the second option:


There is a second option on how to export to excel. This happens when you right click on the report and then you have the pop up menu which comes in the IE browser, there is an option to export to excel here. When you choose this option, only the data in the SSRS report is exported, it loses the custom formatting. It is in this option that one tends to start seeing blank columns when you have the interactive sort turned on the columns in the report. I should have been more explicit when i blogged about the excel export option in my previous post. Here is the image for the second option:

Friday, July 16, 2010
Interactive Sort,Blank Columns,Excel Export
One of the constant/standard task that happens when a SSRS reports is developed is that the data in the report is exported to Excel. I had developed a report which had the Interactive sort turned on the columns. The user liked this feature so we made it a standard requirement while developing the reports. One of the issues which I faced was when the report (which had the interactive sort on the columns) was exported to excel, there were blank columns being added after each column. Then i went through forums and discussions, checked the alignment of each column in the report, made sure there were all lined up correctly, there were no headers or footers overlapping the data area. Once these were all checked, did the export , still saw the blank columns. Then i started turning off the interactive sort on couple of columns, did the export to excel, the blank columns did not appear. So it turned out that the interactive sort on SSRS reports can distort data when exported to excel. Here is a link from microsoft which states these features are not persisted in the export.
http://msdn.microsoft.com/en-us/library/ms345232.aspx
Interactive sorting
Preview/Report Viewer
For tabular repots, users click sort arrows on column to change how the data is sorted.
HTML
For tabular repots, users click sort arrows on column to change how the data is sorted.
PDF
Not available in PDF.
Excel
Not available in Excel.
http://msdn.microsoft.com/en-us/library/ms345232.aspx
Interactive sorting
Preview/Report Viewer
For tabular repots, users click sort arrows on column to change how the data is sorted.
HTML
For tabular repots, users click sort arrows on column to change how the data is sorted.
Not available in PDF.
Excel
Not available in Excel.
Monday, July 12, 2010
Managing Reports...
I am working on a project where i had to clean up unused,not needed reports from our portal. As part of the project the unused subscriptions also had to be removed. The portal has several folders with a quite a number of reports. In order to make the task easier, I utlised the tables available in the ReportServer Database, which hold data regarding the reports and its schedules. Some of the important tables to be aware of are 1. Catalog, 2. Subscriptions, 3. ExecutionLog, 4. ReportSchedule, 5. Schedule. One can write queries involving these tables to get a list of reports which have subscriptions, the reports which have been accessed by users and when the reports were pulled. I essentially made a SSRS report out of the queries and used the report to manage by cleanup operation. I would like to thank Devin Knight for his blog entry on the same subject, http://www.bidn.com/articles/reporting-services/110/monitoring-reporting-services-subscriptions.
Here are some of the queries which I used: The following query gives the Report name, the last time it was run, the status of the run and the user who accessed the report. The LastRun Time and Last Status comes from the Subscriptions table.
select Catalog.Name,UserName,MAX(Subscriptions.LastRunTime),
LastStatus from Catalog
inner join ExecutionLog
ON ReportID = ItemID
inner join Subscriptions
On Report_OID=ReportID
WHERE Catalog.Path like '/Your Path/%' -- This is the report path on the report server.
GROUP BY Catalog.Name,UserName,LastStatus
GO
One can also use the following query to find out which user is getting subscriptions (there could be a better way..)
select Name,UserName,MAX(LastRunTime) As LastSentDate,LastStatus from Catalog
inner join ExecutionLog
ON ReportID = ItemID
inner join Subscriptions
On Report_OID=ReportID
WHERE LastStatus LIKE '%FirstName.LastName%' --One can enter a email address or a pattern here.
The tables in the ReportServer database are helpful while managing and adminitering the Reporting Server.
Friday, July 9, 2010
SSIS 2008-Conditional Split
Initially in the SSIS packages which were developed, I used a lot of Execute SQL Tasks which had calls to stored procedures. Then there were business changes I had different data sources to pull the data from. This led me to use different Data Flow Transformations in the Data Flow Task. One of them i used was the Conditional Split transformation. This transformation can be used to go through a dataset row by row and perform checking on different columns and create different output paths. In my Data flow, I had data coming from a sql server table, the data had 5 columns. Based on the CustomerType column I had to direct the output to different data sources, In my case i had to create 2 different text files as outputs. When you right click on the conditional split task and click edit, the Conditional Split Transformation editor opens up. In this editor one can create Different ouput streams and give the conditions for each output, also there is a default ouput name. The conditional split editor provides different functions which can be used in conditions. Data Transformations tools provide neat ways of performing transfomations but at the same time one has to test the performance of these tasks before deploying to production.


Wednesday, July 7, 2010
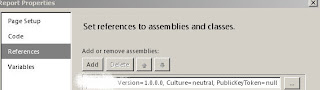
SSRS-Reference to Assemblies...
In one of my earlier posts I had written about the use of Report templates in order to standardize the development of reports. One of features that is available is the use of references to assemblies. In certain cases we would have code as part of the report properties. In the Report properties window there is a section called References, here one can add assemblies and also add classes available in assembly. These classes were created in Visual C#, in these classes certain standard functions were created. This would decrease code duplication in the reports for certain standard calls, for example use of dates , names in certain formats etc. The functions can also encapsulate certain standard Business functions, these function calls can be made from reports to provide consistent use of business rules. The assembly is usually a compiled .dll file which needs to be referenced as shown in the figure below. The name of the .dll has been masked since these are used at work.

Tuesday, July 6, 2010
SQL Server 2008 R2...
The new version of sql server, sql server 2008 R2 has been out for a while now. There has been a lot of new features added to the reporting services. These features have been listed here: The features have been categorised into various categories like Data Visualization, Report Layout and Rendering to name a few:
http://msdn.microsoft.com/en-us/library/ms170438.aspx#ReportAuthoringTools
http://msdn.microsoft.com/en-us/library/ms170438.aspx#ReportAuthoringTools
Subscribe to:
Posts (Atom)