Data Science has been experiencing tremendous growth in the business world today, there is a tremendous scope/job opportunities for people with Data Science Experience. One of the challenges has been to learn the different components of Data Science since most of them involve lot of Statistical, Math, Data Mining Algorithms knowledge. Microsoft on its part has been working steadily expose data science for the programming public. Initially Azure was slow to take off, but now with growing cloud implementations, Azure has been experiencing a lot of growth. So Microsoft decided to use the Azure platform and provide Data Science tools for the programmers. One of the very effective tools that is offered is called the Azure ML Studio, this is a development environment for Machine Learning Model Development. The interface of this tool is similar to some of the Visual Studio tools provided earlier by Microsoft. In order to start using a the Azure ML Studio one needs to have a Azure account. The whole concept of Azure ML works on the concept of Software as a service. One can use the following link to learn more about the Azure ML capabilities:
https://studio.azureml.net/
Once you login to the azure studio, the first that will happen is that the workspace will be set up. There will be a + symbol at the bottom of the workspace, click on that to create your first experiment. You have a couple of choices here 1) You can create a blank experiment 2) You Can create a experiment based on the templates provided. The option 2 would help one to set up an experiment quickly and understand the various components of the experiment. When you choose from the samples, you can either open it in ML Studio and view it in the gallery. I feel tools like Azure ML studio provide a great first step in exploring the power of Machine Learning/Data Science.
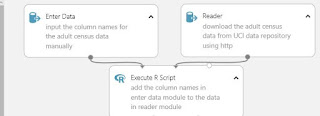
One of the components in the above image is the Enter Data component. This component is primarily used for defining column headings, these column headings can be used to assign to the data sets that are read through the Reader component. In this case in the Reader component, we are downloading a file from a website. Since in this example the headers of the file downloaded by Reader component were not user friendly, we use the Enter Data component to provide meaningful column_names. In this example we have used the column_names to be in the csv format. For example please see the image below for Enter Data component:
In the image above the column_name is the header in the csv file and the other below it are actual column names which would be used to assign it to the data set ready by reader component.


