
Monday, April 9, 2012
Custom SSIS Logging...
In one of my blogposts I had blogged about using the Logging Options Provided by SSIS. The options available in SSIS are good. Depending on one's needs one could develop Custom SSIS logging solution. One of the options I have utilised is to use a table in a SQL Server database, create the table with meaningful columns which capture information that would help in troubleshooting and auditing. The columns which i would like to include are source_rows, Inserted_rows,error_rows. These would enable a developer to keep track of how data is flowing through a SSIS package. The audit table for example could be named as SSIS_Package_Audit with columns such as ( UniqueId(Identity),PkgName, StartDate, EndDate, SourceRowCnt, InsertRowsCnt, ErrorRowCnt,ElapsedTime_m, LastError,ServerName,DatabaseName). When a Package starts as one of the first steps in the SSIS package, a new row is inserted into the table to indicate that the package has started. As the package progresses through different points, the audit table can be updated. In case the package encounters an error, an update can be made to the LastError Column in the table with an appropriate error text. This could tell us what error was encountered when the package was run. Inserts and Updates to the audit table can be done through a Execute SQL Task or a Script Task.
 I have included a image for reference, The first script task inserts a row, the last script task actually updates the row which was inserted with values for the rowcounts and enddate, Last error column would be set to NULL. This would indicate a good run of the SSIS package. The solution being presented here is a starting point, this can be greatly enhanced to suit the business needs and dependencies of packages could be included in the table.


Thursday, April 5, 2012
SSRS 2012
With SQL Server 2012 being released there is lot of new features all across the board which are being studied and used. The mechanisms to pull data and use data in different ways is ever exploding. SQL Server Reporting Services 2008 and 2008 R2 were good releases where in SSRS started to being looked at as a reporting tool with good features and capability. SSRS 2012 has an increased set of features, Microsoft has listed the main highlights of the new product. Sharepoint is also getting lot of traction in lots of companies these days. In order to look at what is new in SSRS 2012, here is a link:
http://msdn.microsoft.com/en-us/library/ms170438.aspx
I am planning to start working with the evaluation version of SQL Server 2012 and keep abreast of what is being offered.
As a side note: I am including a nice article on how to land a job as a developer: This appeared in SQL Server Central as well.
http://blogs.msdn.com/b/thebeebs/archive/2012/03/30/6-189-tips-for-landing-a-developer-job.aspx?CommentPosted=true#commentmessage.
http://msdn.microsoft.com/en-us/library/ms170438.aspx
I am planning to start working with the evaluation version of SQL Server 2012 and keep abreast of what is being offered.
As a side note: I am including a nice article on how to land a job as a developer: This appeared in SQL Server Central as well.
http://blogs.msdn.com/b/thebeebs/archive/2012/03/30/6-189-tips-for-landing-a-developer-job.aspx?CommentPosted=true#commentmessage.
Wednesday, April 4, 2012
Data Visualization-Part 2
As Newer software and newer versions of operating systems are getting rolled out so is the field of data visualization which is rapidly expanding. In my earlier posts I had blogged about data visualization and Powerviewer. In this blog post I would like to share new tools which have come out and which address different platforms. Computerworld magazine has come up with a article which looks into 8 Data visualization apps and summarizes the findings.
http://www.computerworld.com/s/article/9225318/8_cool_tools_for_data_analysis_visualization_and_presentation?taxonomyId=9&pageNumber=1.
The article nicely summarizes the different operating systems on which these apps run.
http://www.computerworld.com/s/article/9225318/8_cool_tools_for_data_analysis_visualization_and_presentation?taxonomyId=9&pageNumber=1.
The article nicely summarizes the different operating systems on which these apps run.
Wednesday, March 28, 2012
SQL Server Certification-2012
With the SQL Server 2012 being released and making its way into the enterprise. The certifications program for SQL Server 2012 are being readied for launch. How much certifications help out has/is will be a subject of debate. Keeping debates aside, Microsoft has provided information on how to go about it. Here is the link to:
http://www.microsoft.com/learning/en/us/certification/cert-sql-server.aspx#tab2
It is being recommed that folks complete certifications for SQL Server 2008 before getting into SQL Server 2012 one of the reasons being that the path will be shorter. I guess more will be know about these as the program rolls out in June 2012 (as mentioned in site).
In case any one has completed the SQL Server 2008 BI certification, could you please share the resources in the Comments section of the blog.
Thank you
http://www.microsoft.com/learning/en/us/certification/cert-sql-server.aspx#tab2
It is being recommed that folks complete certifications for SQL Server 2008 before getting into SQL Server 2012 one of the reasons being that the path will be shorter. I guess more will be know about these as the program rolls out in June 2012 (as mentioned in site).
In case any one has completed the SQL Server 2008 BI certification, could you please share the resources in the Comments section of the blog.
Thank you
Friday, March 16, 2012
SSRS-InitialToggleState
I was working on Developing a SSRS report which displays data about SSIS packages and package dependencies. To get a better perspective the report displays data about packages and its dependencies meaning which need to be completed before running a particular package. I created a stored procedure to provide data in a Master/Detail format and worked on presenting it in a SSRS report. In the report I had the detail row which was the dependencies, the main column on which the report was grouped on was the Parent/Master package column. The idea was to provide a collapsible master/detail report such that when expanding the Parent package one can see the dependent packages in the detail on the same report.
The SSRS report has a list of Package Names as a parameter with Multi Select enabled. By default the report runs for all the values and displays the parent Package and it s dependencies. The issue was that the
'+' sign was appearing before the Parent Package Value and also the details were shown. Ideally we should have the '-' sign appearing before the Parent Package name since all the details are show when the report is run initially. In order to handle this scenario I used a Property which is available for a column in the report, it is called the InitialToggleState Property. By default this property is to false, this was making the '+' sign appear before the column data in the report. I set it to True and ran the report, this displayed the data with the '-' sign in front of the Parent Package and the details were displayed in the same report.
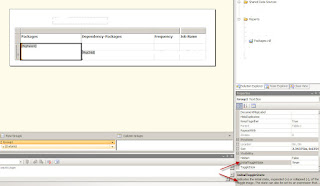
Below is an image with the Report result:

The SSRS report has a list of Package Names as a parameter with Multi Select enabled. By default the report runs for all the values and displays the parent Package and it s dependencies. The issue was that the
'+' sign was appearing before the Parent Package Value and also the details were shown. Ideally we should have the '-' sign appearing before the Parent Package name since all the details are show when the report is run initially. In order to handle this scenario I used a Property which is available for a column in the report, it is called the InitialToggleState Property. By default this property is to false, this was making the '+' sign appear before the column data in the report. I set it to True and ran the report, this displayed the data with the '-' sign in front of the Parent Package and the details were displayed in the same report.

Below is an image with the Report result:

Thursday, March 8, 2012
SSIS Documentation...
One of the important tasks when there are ETL SSIS packages being developed for a Data Mart/Datawarehouse project is ability to document the SSIS packages. It is sometimes very time consuming to open package by package and then go through all the tasks to understand what is being done in the package. The other issues here is that there is a dependency on Visual studio being present on the laptop/PC. One of the products available to perform this type of task is called SSISDocumentor, this product supports both SSIS 2005 and SSIS 2008. The product can be downloaded from the website:
http://www.ssisdocumentor.com/. Once the product is downloaded, the installation is very straightforward. When the installation is complete in case BIDS/Visual studio is already open, save the work and exit out of VS/BIDS. Reopen Visual Studio/BIDS, open up the SSIS project/solution or the package. In the Solution explorer, right click on the SSIS package that requires documentation and once can see the Generate Documentation Option. Please see image below:
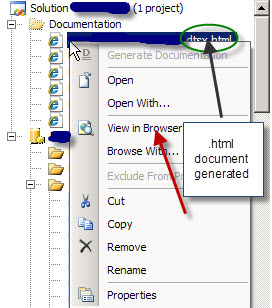
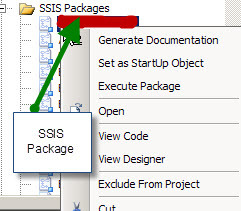 Click on the option, once the document is finished, a folder called Documentation is created and in the folder one can see the package documentation with a .html extension. The neat thing about the .html option is that the documentation can be viewed in a browser. Right click on the .html like shown in the image below and choose view in browser, the documentation will open up in the browser.
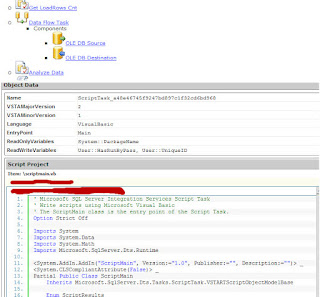
There are 2 types of documentation available Brief/Verbose. Each of the task in the SSIS package is depicted in a diagram and one can click on any task, then it takes you detail of the task. The script/sql statements are depicted in a neat way like an editor and once can copy the script/sql statements to the clipboard or any other tool to examine the statements. The documentation tool is very helpful for developers,architects and support folks who need to analyse the package and understand the flow of data from source to destination. This type of SSIS documentation can greatly enhance the stability of an ETL group and in cases where folks leave, it would be very helpful for developers who are coming on board to the team. Snapshot of the documentation below:
http://www.ssisdocumentor.com/. Once the product is downloaded, the installation is very straightforward. When the installation is complete in case BIDS/Visual studio is already open, save the work and exit out of VS/BIDS. Reopen Visual Studio/BIDS, open up the SSIS project/solution or the package. In the Solution explorer, right click on the SSIS package that requires documentation and once can see the Generate Documentation Option. Please see image below:
There are 2 types of documentation available Brief/Verbose. Each of the task in the SSIS package is depicted in a diagram and one can click on any task, then it takes you detail of the task. The script/sql statements are depicted in a neat way like an editor and once can copy the script/sql statements to the clipboard or any other tool to examine the statements. The documentation tool is very helpful for developers,architects and support folks who need to analyse the package and understand the flow of data from source to destination. This type of SSIS documentation can greatly enhance the stability of an ETL group and in cases where folks leave, it would be very helpful for developers who are coming on board to the team. Snapshot of the documentation below:

Tuesday, March 6, 2012
Data Visualization...
The area of Data visualization has heated up with so many devices to choose from to display the data. With the rise of in memory BI offerings the level of data visualization has increased considerably. There are some niche players and some big vendors. The big companies are surely keeping an eye on the niche vendors which are doing well. The following blog entry talks about the Gartner report and takes a different view on the findings in the report. The blog also gives out lots of detail on different tools in the data visualization field.
http://apandre.wordpress.com/2012/02/12/data-visualization-platforms/
http://apandre.wordpress.com/2012/02/12/data-visualization-platforms/
Subscribe to:
Posts (Atom)