Tuesday, December 31, 2013
Happy New Year - 2014...
Year 2013 had a lot of changes/new entrants in the area of BI/Big Data/Cloud/Mobile Analytics. It is exciting times and hoping the new year 2014 offers more clarity and direction in this domain. Wishing every one and all the blog readers a happy and prosperous New Year 2014. I hope to write more insightful articles in the coming year, trying to motivate myself to provide better content. Have Fun and Be Safe.
Wednesday, December 25, 2013
Big Data and Hadoop...
In the coming year 2014, which technologies will take off, there is a lot of discussion about Cloud, Mobile, Big Data and Self Service BI. It remains to be seen if Big Data takes the leap in 2014 and see more adoptions of Big Data related technologies. One of the most important aspects to Big data is to understand what Big Data is, where would the technologies be applicable. There is a lot of hype around Hadoop, so it is very important to understand the nature of requirements and then make a decision on whether Hadoop is relevant or not. Please use the following link for a good tutorial on Hadoop and the related tool set. HDFS is not a good fit in situations where there are
1) Lots of small files,
2) Low latency data access
3) Multiple writers.
https://www.youtube.com/watch?v=A02SRdyoshM
Hope the readers will find the above video useful. Also there is a another series on big data published by SQL Server Expert and Friend, Pinal Dave in his blog: http://blog.sqlauthority.com/2013/10/30/big-data-learning-basics-of-big-data-in-21-days-bookmark/, it is a 21 part series well researched and presented. Pinal is one of my favorite authors, he was a big part of the reason why I decided to start a blog on SQL Server BI.
Friday, December 20, 2013
Power BI....
There are some interesting trends to look forward to in the BI Space, there are advances being made in Cloud BI offerings from different Vendors. Also there is a possibility as discussed by leading BI experts that traditional BI Implementations could slowdown in the Year 2014, with more opportunities for newer type of BI implementations such as Self Service BI. Keep in tune with the cloud based offerings, Microsoft is offering a suite of products with the cloud version of office, Office 365. Microsoft is providing a set of tools that Interact with data in Office 365 and Excel. As per Microsoft "It's easier than ever to transform complex data into meaningful insights and share them with your team. Power BI for Office 365 is a powerful new way to visualize and interact with data in Excel and Office 365. Search, discover, and with just a few clicks, analyze, shape, and transform your data into stunning interactive visualizations that uncover hidden insights. Work, collaborate, and share from anywhere, on any device with Power BI for Office 365".
http://www.microsoft.com/en-us/powerBI/default.aspx#fbid=4fJwgwe08Zn
Power BI has a different sets of tools such as:
PowerPivot - To model and Analyze.
PowerView and PowerMap - To Visualize Data.
PowerBI also provides the ability to access data anywhere and also share, collaborate with the different teams. The Power BI team at Microsoft also maintains a blog at the site below:
http://www.microsoft.com/en-us/powerBI/bi-blog.aspx#fbid=4fJwgwe08Zn.
It will be really interesting to see how companies will adopt the Power BI set of tools from Microsoft.
Monday, December 16, 2013
Bulk Copy/Bulk Insert - Data Sourcing
Recently I have been working on a project which invloves Data being sourced to SQL Server. As part of the handshake between the source and target SQL Server System, A log file had to be read to get information regarding how many records were pushed to different tables as required by the Project. As part of consuming the log file text information into a table in sql server, I was using BULK INSERT command which was working fine. One fine day the process of data sourcing failed, because the logic in the job could not identify the rowcounts present in the Log file content. As I dug deeper I found out that the Log file data was getting internally ordered by a timestamp value present in the begining of each line, this internal sorting was happening because of the BULK INSERT command. The issue was that when the Day crossed from 11:59 PM to 12:01 AM, the contents of the log file in the table got jumbled up, this caused the ordering source to be distorted. As part of a alternative solution we tried using BCP to consume the Log file (text file content) into the table, also one of the main issue that was crucial for us was to maintain the ordering present in the log file and not tamper with that sequencing. When we built the BCP solution, in order to be absolutely sure that we are reading the file in a forward fashion is to use the parameter, [-b batch_size] as part of the bcp command. By Default BCP will consume the file (source log file) as one big batch. Since we wanted to maintain the ordering of the log file, i set the batch size to 1, so the parameter -b 1 was added to the bcp command which was used to source the log file. Once this was set, the log file contents were read into the table in sql server one line at a time and the ordering of the log file at source was maintained. This helped my process to find out the counts from the log file and validate the data in the target. It was kind of challenging to figure out the data being sorted and also use bulk data import tools to read the source data one record at a time, the performance was not affected as the log file was not huge. It is also important test as much as possible when one is trying to integrate/source from another system.
Tuesday, December 10, 2013
Data Integration-Data Readiness
Currently I have been working on lot of Data Integration projects, this involves lot of sourcing of data from various system. While sourcing data one of the key aspects to find out if data is ready at source. There are also situations where some other systems could be using your system as a source. In both of the situations it is very important to come up with a Data Readiness strategy. It is extremely important to have a good sourcing strategy since there are SLA's that are to be met and the Business needs data more than ever before to make good decisions. What is involved in Data Readiness? The source systems need to come up with a plan to have data readiness indicators once all the objects/tables have been updated. In my projects the Data Readiness is table driven, normally there is a table which would have the following attributes:
DatabaseName
Date
Schema
TableName/Object
CompletedFlag
LoadStartDate
LoadEnDate
UpdateDateTime
SLATime
When the source tables are updated with data and all the data related operations are complete, there would be a process to update the DataReadiness table which update all the above attributes and set the CompleteFlag Indicator = 'Y'. The Systems which would need data from the source would keep polling the DataReadiness table to check the CompletedStatus and also the UpdateDatetime. The reason to check the UpdateDatetime column is to make sure that the system that is pulling data from the source is trying to get the most recent update on the source system. The Data Readiness layer allows a level of abstraction in the sense that systems requiring data need not check individual source tables. The Data Readiness table can be used to indicate when the jobs need to be run to pull the actual data. In case Target systems are lagging behind with respect to the data update, the Data Readiness layer can be used to catch up with the latest updates on the source systems.
Friday, November 29, 2013
SQL Server Management Studio - Project
One of the features I like in sql server management studio is when the Solution Explorer got added. This is very similar to the one in Visual Studio, one of the nice things about this is the ability to keep things organised. When working with sql server Management studio and one is on a large project/being dba is to use multiple query files. Even though one maintains the files in folders, using the solution explorer can keep things organised. The solution explorer allows one to maintain the important server connections and queries all in one place. One of the options I noticed recently in SSMS is what you see in the image below: When you click on the File Menu option, at the end very of the list one can see a Move Option:
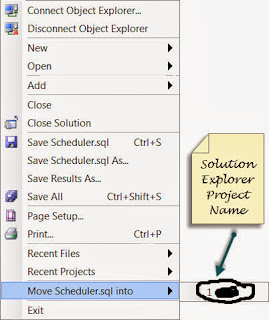
The Purpose of the Move option is to take your current active query file and move it one of your active projects in solution explorer. Once you choose the project the query gets added to the project in solution explorer. One of the nice things about this option is that it allows to quickly place the .sql to the project instead of going to the solution explorer and adding it. I have highlighted the query file after getting placed in the project.


Monday, November 25, 2013
SQL Server 2014 - In Memory OLTP...
In the Pass Summit held in Charlotte last month, there was lot of focus on SQL Server 2014, especially the In Memory OLTP component. This particular topic has triggered interest in this version. In order to test this feature out of course needs to set up the environment right. Please refer to the following links for detailed information about In Memory OLTP operation. The following links answers questions like :
Is In-Memory OLTP the solution to all my performance concerns?
http://blogs.msdn.com/b/sqlcat/archive/2013/11/13/sql-server-2014-in-memory-oltp-discussions-at-pass-summit-2013.aspx
http://blogs.technet.com/b/dataplatforminsider/archive/2013/09/17/new-amr-tool-simplifying-the-migration-to-in-memory-oltp.aspx .
http://blogs.technet.com/b/dataplatforminsider/archive/2013/10/11/in-memory-oltp-how-durability-is-achieved-for-memory-optimized-tables.aspx.
Hope the readers have a good insight into In Memory OLTP.
Saturday, November 23, 2013
SQL Server 2014
As the field of databases continues to grow with lot of progress in the area of big data, the current crop of relational databases are starting to build in features which are gaining a lot of traction now. The areas are cloud computing, in memory analytics/databases, availability of BI on different platforms such as mobile. As SQL Server 2012 continues to be adopted by different customers, the time to upgrade is a lot slower now because of the complexities/cost involved, Microsoft has announced the next version of SQL Server, SQL Server 2014. I have been talking to some of my colleagues who have SQL Server 2008 right now, one of the topics we discussed was upgrades and they mentioned that they would probably go to SQL Server 2014 directly instead of going to SQL Server 2012 first, I hope that one can migrate to SQL Server 2014 directly. As per Microsoft, "SQL Server 2014 delivers new in-memory capabilities built into the core database for OLTP and data warehousing, which complement our existing in-memory data warehousing and BI capabilities for the most comprehensive in-memory database solution in the market".
http://www.microsoft.com/en-us/sqlserver/sql-server-2014.aspx. One of the features to be present in SQL Server 2014 is it introduces hash indexes for memory-optimized tables. Hash indexes are very efficient for point lookups, when you know exactly the value you are looking for. However, they do not perform well if you need a range of value, for example a date range, or if you need to retrieve the rows in a particular order. Apparently Hash Indexes offer better performance for point lookups.
For more details on this topic, please refer to the following link:
http://blogs.technet.com/b/dataplatforminsider/archive/2013/11/12/sql-server-2014-in-memory-oltp-nonclustered-indexes-for-memory-optimized-tables.aspx
Wednesday, November 6, 2013
CDC Update & TFS 2013
In my previous blog post I had mentioned about the CDC Session I had attended. One of the important points which was pointed out during the session was the realtion between the database recovery mode and CDC in sql server. When a Database is in Bulk logged or simple recovery mode and CDC need to be performed on the tables in the database, the recovery model changes to fully logged. The reason being the CDC has to read the log before the log backup otherwise the whole purpose of CDC would be lost. One more key point need that need to be kept in mind is that there is no overhead for CDC in sql server.
The other topic which I would like to discuss in this post is that of Team foundation Server 2013. There has been quite a bit of changes to TFS 2013. One of the main aspect of TFS 2013 is that there is now a web based interface for working with TFS. When you log into TFS 2013 on the web there is a dashboard which presents menu options such as Home, Code,Work,Build, Test. There are online team rooms which people working on a project can chat/discuss about the different changes that happen to the code base. It provides a collaborative way of working by using the web interface and provides a list of activities that need to be performed along with the members who belong to the project. Please see the couple of images below to get an idea of the web based interface for TFS 2013.

The other topic which I would like to discuss in this post is that of Team foundation Server 2013. There has been quite a bit of changes to TFS 2013. One of the main aspect of TFS 2013 is that there is now a web based interface for working with TFS. When you log into TFS 2013 on the web there is a dashboard which presents menu options such as Home, Code,Work,Build, Test. There are online team rooms which people working on a project can chat/discuss about the different changes that happen to the code base. It provides a collaborative way of working by using the web interface and provides a list of activities that need to be performed along with the members who belong to the project. Please see the couple of images below to get an idea of the web based interface for TFS 2013.


Sunday, October 20, 2013
SQL Saturday - ETL,CDC and Hadoop
Finally the day arrived and I was excited to attend the SQL Saturday Event in Charlotte on October 19th. The arrangements were very well done, really liked the idea of Speedpass to make the registration process. There were a good number of vendors from product companies to consulting firms. The schedule was pretty impressive in the sense that it was broad range of topics, My first session was about ETL and ELT by Paul Rizza. The topic covered a wide range of topics in SSIS with respect to the pitfalls that one need to watch out for, the tasks and logic in SSIS which can drag performance. The interesting property about how to indicate that the records are sorted at source and how this would help prevent SSIS from performing sort before a Merge Operation. The property sort at source is indicated in the source connection advnaced properties. There was an another interesting discussion about the RetainSameConnection property. This property works well except in cases of parallel execution where the same connection cannot be utilised. There were interesting tidbits about the SSISDB catalog what to watch out for when moving between servers. There was a good discussion about Raw file types which are storngly typed. One of the biggest advantages using the Raw file type source is that the files size are a lot smaller and the strongly typed nature of the files helps SQL Server not perform data type validation before doing a bulk insert. This was an neat feature for me. The performance issue with For Each Loop Container was discussed in detail, especially when one used a For Each Loop container and uses Execute SQL Task within, how many logging operations happen. One of the good replacements for a For Each loop container would be a Data flow task in SSIS. There was a lot of good discussion about memory usage by SSIS, also a look into the Lookup tasks especially with respect to Partial Cache and Partial No Cache. The pitfalls of using command destinations and user defined functions. The session was filled with interesting tidbits about SSIS.
The second session was about Hadoop, with hadoop gaining a lot traction, the session was fully packed. The presentation by Rick Hallihan and Bill Carroll was very informative, the session began with an overview of Hadoop, MapReduce and the tools available in the Hadoop universe, then the topic move on to How Microsoft is adopting Hadoop through HD insight collaboration with Hortenworks. There was a word count example demonstrated in Hadoop and then the same repeated with a C# .Net example within visual Studio 2013. There are class libraries present in .NET which support the Hadoop Mapreduce functions. The main part of the session was to create Hadoop cluster within Windows Azure using HDInsight. The Hadoop cluster was set up in windows azure in 4 clicks, the cluster had 4 nodes. There were comparisons made between the SQL and Big data world, overall a very impressive session.
The third session i attended was about CDC (Change Data Capture) present in SQL Server 2008. The CDC feature is very useful for auditing, datawarehouse especially SCD build out. The change between CDC and CT (Change Tracking) is that with Change tracking feature only the row change information is captured and there is no history maintained with respect to Change Tracking feature. CDC will work on tables that have Primary keys only and the source database has to be a SQL Server Database. There was good example demonstrated where there was a delete of records made on a table which is enabled for CDC by mistake and how using the CDC tracking table one can recover the deleted records, in case CDC feature was not there then this would be a perfect storm. The session was presented by Jose Chinchilla (http://www.sqljoe.com).
Monday, October 14, 2013
SQL Saturday-Charlotte
SQL Saturday are a very good way to keep up with happenings in the sql server world. The sessions have very good speakers covering a wide variety of topics. The SQL Saturday scheduled for October 19th in Matthews (Suburb of Charlotte) is focused on SQL Server BI Stack, with topics including Hadoop & Big data. The event promises to be very exciting with a wide range of topics and speakers.
Please refer to the links below for more information on the session and the schedule of topics. Topics include:
ETL, Data Visualization, Self-Service BI, Data Quality, Master Data Management, OLAP, Big Data, SharePoint, Data Management
SQL Server Saturday: http://www.sqlsaturday.com/237/eventhome.aspx
Schedule Link: http://www.sqlsaturday.com/237/schedule.aspx
Thursday, October 3, 2013
Gartner Report - BI Tools
It is always interesting to read the different reports which cover the BI space which is growing at a enormous space with vendors coming with different capabilities and covering different aspects plus the Cloud Based Offerings. Here is a link to the Gartner report which discusses the BI quadrant for 2013. Some quotes from this report:
Microsoft leads in ability to execute
As I did with the DW report, I'll start with the "winners" in this MQ. Each axis ("ability to execute" and "completeness of vision") had its own winner, and that for the former is Microsoft. I tend to go out of my way to point out my bias on Microsoft. I've long thought the MS BI stack provided significant value, and have watched that value increase recently with the introduction of PowerPivot and SQL Server Analysis Services Tabular mode (in-memory column store databases that are highly integrated with Excel and SharePoint) and Power View (interactive visualization technology integrated with those same products). Microsoft has also recently added Master Data Management and Data Quality tools that, while still maturing, round out very nicely a stack that costs little to nothing for customers already using SQL Server, Office and SharePoint.
Please read the full report below:
http://www.zdnet.com/gartner-releases-2013-bi-magic-quadrant-7000011264/
Thursday, September 26, 2013
PowerPivot,PowerViewer and Excel 2013...
I finally got to install the office 2013 suite and the first thing i was curious to check out was tie in to the Powerpivot and Powerviewer tools. These 2 were integrated with Excel 2013, there has been a lot of discussion about this especially the Powerviewer piece and whether it needs to be tightly integrated with Excel. In Excel 2013, under the File /Options menu, there is a section for Add-on. In the list of Add-on, one will be able to see the add-on for Powerpivot and Powerview. Click on the check box right beside the add-ons. In the bottom portion of the screen, there is a drop down to manage add-ons, one would need to choose COM Add-on and then click ok at the bottom of the screen.

The next screen is where one can make the Add-ons Active, click the check box next to add-ons and click Ok. Once this is complete, one should be able to see the PowerPivot option on the Menu. Click on the PowerPivot Option, there will be a Manage option on the main bar. Once you click the Manage option, there will be a new window which will be presented to manage the database connection and do the data analysis.

![]()


The next screen is where one can make the Add-ons Active, click the check box next to add-ons and click Ok. Once this is complete, one should be able to see the PowerPivot option on the Menu. Click on the PowerPivot Option, there will be a Manage option on the main bar. Once you click the Manage option, there will be a new window which will be presented to manage the database connection and do the data analysis.


Thursday, September 12, 2013
Data Dictionary
In today's world of data management, business intelligence, data warehouse the amount of data is growing along with the amount of attributes being captured. It becomes very important to have proper data management principles in place. One of the aspect is data dictionary, it is very important to persist the information which would make it easier for users to access. This would enable in finding out what attributes are being made available and where they are sourced from. I would like to explain one of the ways it has been done projects I have been associated with. First thing is there is a template that would capture information regarding source systems in terms ( Database, Table,Server). In addition to this would where the table would end up, sometimes there is a landing area where information first comes in and then the data would be moved into the user databases. The information pertaining to Landing databases, tables, server need to be captured. At this stage one would identify key columns, if the attributes are NPI/Non NPI, if the attributes are Nullable/Non Nullable. Once this is done in the template we would capture the data type/scale information. One of the important in the template would be how each table would be loaded. A table can be loaded in full meaning it is refreshed everyday or we get changed information , only record that changed. Once all of this information is captured in a template (in excel), the information can be validated using a set of rules (database standards). One of the ways which this can be done is through macros in excel (assuming the template is maintained in this format), any errors would be displayed across each entry in the DD. Once the errors are fixed, the macros can be used to generate SQL Statements. These SQL Statements can be used to persist meta data information in the database. I have found the concept of data dictionary and persisting them in a database for Data Integration Projects.
Key Information:
Source Server/Database/Tables
Landing Server/Database/Tables
User Database/Server/Tables
Column data type/scale/size information
Key Colums/NPI/Non NPI columns
Type of Data Load.
Key Information:
Source Server/Database/Tables
Landing Server/Database/Tables
User Database/Server/Tables
Column data type/scale/size information
Key Colums/NPI/Non NPI columns
Type of Data Load.
Monday, August 26, 2013
Reporting Requirements...
In today's Business Intelligence world, there is a lot of requirements for reporting. There are lot of different types of reporting which includes adhoc,operational and discovery analytics reporting. In order to handle reporting requirements effectively one needs to have a strategy of how reports will be deployed and presented. One of the options is to have a Reporting Dashboard on a SSRS reporting Portal, the other options is to have a Sharepoint based Dashboard/Portal having key reports. The other aspect apart from Presenting the reports is how does one go about gathering requirements for reports. The following points/questions could be followed:
1. Decisions to be made with the Report.
2. Report Samples.
3. What is the report generation Complexity (This can be used to gauge the amount of development effort involved).
4. Report Complexity- This follows point number 3 very closely. This could given idea of what types of data sources are involved to get data for reports.
5. The Estimated number of users for the reports.
6. Report Distribution Channel .
7. Frequency of Reports.
8. Business Logic for Reports and anticipated frequency of change for Business Logic.
9. Is there a need for BI Solution (Cube Based Reports, Discovery analytics, Adhoc, Canned/Near Real time)
10. How are Reports Generated.
The above 10 points could be used as a guide for gathering reporting requirements and the feedback for these questions can give pointers to what type of reporting is required and can be generated. The list of points given is by no means exhaustive, these are some broad pointers.
Saturday, July 27, 2013
Real Time Replication...
Continuing on my previous post about Near Real time replication, the demands for accurate and timely information has been on the rise. Business decisions are very critical and the timeliness of information is a essential prerequisite. In order to address this segment there are various products available in this space, one of them is SQLDR Plus from Starquest, www.starquest.com. The product SQLDR Plus addresses the need for reliable and real time replication. To quote starquest.com
"Easy replication of data has become an essential part of managing information as people discover new ways of sharing and distributing all types of data.Replication of databases provides essential functions such as backing up data for disaster recovery and distributing information among departments and geographic locations.
Enterprise organizations need to move data between heterogeneous database platforms, such
as between IBM DB2 and SQL Server or between IBM DB2 and Oracle. The StarQuest Data Replication solution provides reliable, high-speed, affordable replication for any ODBC relational database".
The product SQLDR plus addresses the following points.
1. Reliable and Fast
2. Incremental and Snapshot Replication Modes
3. Powerful Data Transformation
4. Secure
Please refer to the following link for additional details.
http://www.starquest.com/Press/Datasheets/StarQuestDataReplication.pdf.
Tuesday, July 16, 2013
Near Real time Data/Analytics...
In the recent years with the advent of newer technologies and lot of application integration efforts, there has been steady increase in demand for near real time data for performing reporting and analytics. In the past years there was lot of operational reporting related efforts. Now a trend is emerging where the Business want to capitalize on the availability of close to real time information to perform analytics. One of the areas where lot of improvements are made is in the area of CDC, change data capture. The feature introduced in SQL Server is being taken advantage of in lot of the projects I am working on. Initially there were other interface systems to provided change data information, now we are able to streamline all the requirements via SQL Server CDC and get change data information. I see the use of sophisticated replication and mirroring technologies being used to reduce the time gap for data availability. This has bought in the need for performing very good architecture to enable near real time analytics. I see a lot of competition between SQL Server and other Database systems to come up with tools/ technology to address these needs. The concept of datawarehouse would probably be modified to handle the near real time requirements along with Unstructured data information. Microsoft is working with Hadoop based vendors to provide integration with NoSQL Data. Please refer to the below link for Microsoft Hadoop Distribution:
http://www.microsoft.com/en-us/sqlserver/solutions-technologies/business-intelligence/big-data.aspx
To quote Microsoft:
HDInsight is Microsoft’s 100% Apache compatible Hadoop distribution, supported by Microsoft. HDInsight, available both on Windows Server or as an Windows Azure service, empowers organizations with new insights on previously untouched unstructured data, while connecting to the most widely used Business Intelligence (BI) tools on the planet.
HDInsights enables you to realize new value in the data you have and can combine these new insights with 3rd party datasets simply and elegantly. The time spent by your data analysts trying to surface the right data and source for your precise needs is costly. By connecting to external data sources you can begin to answer new types of questions and deliver new value in ways that previously were not possible.
Monday, June 17, 2013
Data Quality, Data Management
In today's business world, there is a tremendous growth of data, there is lot of talk and use of Big data methodologies and tools. In order for data to be meaningful and effective it is very important to have data quality and data management standards. There is lot of data flowing through an organisation, how can be i maintained, how are the security concerns going to be handled, what is the value added proposition once can get from the data, these are the questions that need to be answered. One of the first things to do is create a data dictionary which would be a repository of all the sourcing that is done with all the object and attribute level information. The data dictionary could be part of a MetaData database, where in the datadictionary tables can be maintained. The datadictionary would contain information regarding the following areas:
Source of Data
Domain of the Data
Subject/Area of the data
Type of Source: Text Files/Excel/Sharepoint/Database
Frequency of Feeds
Target Database/Tables
Target Type
Attribute Information
Business Contact
Technology Contact
Capturing the above areas in data dictionary would help in maintaining what is being made available in the system. It would prevent data duplication and also give a sense of capacity and what type of data elements are being used. One of the key aspects that need to be paid attention to is how much of storage is being used and would help plan the capacity of data provisioning systems. In addition to maintaining data dictionary is application of data quality standards. What type of data quality is being implemented this could be from the basic checking of columns to complex business rules to determine if the data coming in good. It would be good to have a group which takes responsibility of data governance and quality. It becomes extremely crucial to have such standards in the growing world of data.
Monday, June 10, 2013
BI Multidimensional vs Tabular...Part 2
There is a constant debate about the direction of BI tools from Microsoft, which model will they support, the SSAS multidimensional or the office based Self service BI. There have been passionate exchanges on what will happen to SSAS multidimensional. Well recently in SQL Server 2012 there has been a new functionality that has been released. As part of SQL Server 2012 SP1 CU4, new functionality has been released that means that Power View now works with Analysis Services Multidimensional . Please go through the following link for more technical details:
http://blogs.msdn.com/b/analysisservices/archive/2013/05/31/power-view-connectivity-for-multidimensional-models-released.aspx
As per the MSDN blog: Now Power View users can connect to both the tabular and multidimensional formats of the BI Semantic Model. This is achieved through native support for Data Analysis Expressions (DAX) in Analysis Services multidimensional models, ensuring optimal performance and functionality.
As per Chris webb a leading SQL Server BI expert: This is the first significant bit of new functionality in Analysis Services Multidimensional for a long while, and it acts as a bridge between the classic SQL Server BI stack that most of us are using and the brave new world of Office/Sharepoint-led BI. Please go through his comments on this functionality Here:
http://cwebbbi.wordpress.com/2013/06/02/analysis-services-multidimensional-now-works-with-power-viewand-why-thats-important/
Monday, June 3, 2013
BI Solution-Gathering Requirements
In any project when one is trying to build a target state solution it is important to gather the requirements in a effective way. Very often it is a challenge to gather effective requirements. With respect to building BI solutions it is always preferred to have good requirements. BI Solutions are closely tied with business performance and also provide them capability to do analytics. Here is a link, an article written by SQL Server Expert James Serra on gathering requirements for BI Solution.
http://www.sqlservercentral.com/blogs/jamesserra/2013/05/28/business-intelligence-requirements-gathering/
It is a very exhaustive list, it provides a good perspective on how to approach requirements gathering.
http://www.sqlservercentral.com/blogs/jamesserra/2013/05/28/business-intelligence-requirements-gathering/
It is a very exhaustive list, it provides a good perspective on how to approach requirements gathering.
Wednesday, May 22, 2013
SSAS Tabular Model...
When Microsoft decided to provide tabular model by incorporating in memory analytics capability there was a lot of debate and still going on in the BI space. The debate was that which technology is Microsoft going to support in the future, will it be multidimensional or tabular. Well based on discussions in sql server community, it seems like both will coexist with each serving a different type of user base. With lot of in memory analytics vendors in the market, Tabular model will sure be grabbing a lot of attention from Microsoft and the user base. With SQL Server Data Tools in SQL Server 2012 one can create Tabular Model Projects. Please use the following link to get started on SSAS tabular Model Projects. This is available at MSDN (Microsoft).
http://msdn.microsoft.com/en-us/library/hh231689.aspx
One of the most important aspect of tabular model projects would be the .bim file which gets created when a new tabular model project is created. It goes without saying that SQL Server 2012 (SSAS) Tabular Model needs to be installed on the Server.
The next couple of years will be interesting for tabular models as more companies begin to embrace in memory technologies, how they scale and what value they offer for the business. One of the leading vendors in the In Memory space is QilkView.
Monday, May 13, 2013
SSIS Vs Store Procedure/T-SQL
One of the interesting debates/discussions which happen while discussing an SSIS implementation/Strategy is whether to use SSIS as a shell and do majority of the work the transformation/loading work done by SQL/Stored Procedures. The second option is to leverage the features in SSIS package and reduce the amount of TSQL/Stored procedures. In order to arrive at a optimum solution there are certain key points that need to discussed. The first would be the requirement from SSIS solution, in this there could be the following sub categories.
1. What would be the frequency of Data load into the target system.
2. What type of transformation is required.
3. What would be the requirement for the availability of data to the users.
4. What type of hardware is available at this point and how does it play into the requirement.
It is very important to understand the capabilities of the tools available while building the SSIS solution. Each piece of the ETL toolset would have a capability, positives/negatives, it is very important to understand them.
SQL/Stored Procedures are very good at performing SET based operations and CRUD operations. SSIS is very good at doing parallel processing, String based transformations, lot of functions for different type of operations based on data types, also it is graphical in nature. It is also very important to perform lot of testing while doing a SSIS implementation to get a good understanding of performance in the given server/hardware environment. With respect to transformations, get a good understanding of the complexity of the transformations required by the ETL solution. It would also be highly recommended to look at the metadata of the data sources and destinations and see if any design patterns can be arrived at. From a developer's view point it is important to understand the level of code maintenance involved.
In case you to get more insigh into SSIS best practices, please look into the discussion in Linkedin:
http://www.linkedin.com/groupAnswers?viewQuestionAndAnswers=&discussionID=236893667&gid=59185&commentID=137243006&goback=%2Egmr_59185&trk=NUS_DISC_Q-subject#commentID_137243006
There are very good points listed in the link above by different SQL Experts, it is worth checking it out.
Monday, May 6, 2013
Analytics Reporting and Dashboards...Part 2
In continuation with my earlier blog post, I had the opportunity to get references to some more Analytics reporting and dashboard products. The good news is there is a wide range of tools, also all of them have offerings for the growing Mobile and tablet market. There is a increasing need for delivering BI Solutions on mobile platforms. The 2 Products I have checked out so far has been Strategy Companion (this works on Windows 7 Professional and Enterprise OS, the software does not install on Windows 7 Premium) and bioXL from Pyramid Analytics (has similar set of requirements from Strategy companion). The web site for strategy companion is www.strategycompanion.com. They have products which work for mobile platform as well, they have very good demo videos on the web site and a very helpful support staff. Once you register for a product download they also offer setup support videos which are very useful. They have 3 products Analyzer enterprise, Analyzer Saas and Analyzer mobile. The web site for Analyzer Mobile is http://strategycompanion.com/analyzer-mobile/ and to quote from the web site: Using a “Build Once – Deploy Everywhere” approach, Analyzer Mobile™ enables you to easily provide mobile BI supporting iPads, iPhones, Android smartphones and tablets, BlackBerry smartphones and tablets and Windows Phone 7. No software of any kind needs to be downloaded to anyone’s desktop or mobile device in order to build or deploy your mobile BI reports and dashboards. I found the demos very impressive and would definitely check out more of this product. There other vendors who have product offering in the same space:
They are CALUMO (http://www.calumo.com), their product offerings range from Reporting/Analysis to Dashboards and KPI's. The line up of products are CALUMO for SSAS, CALUMO Skylights and CALUMO Sparks. The company also offers products for Mobile BI Capabilities.
The next vendor I would like to mention is TARGIT, http://www.targit.com/en, they have products offering wide range of capabilities, http://www.targit.com/en/Experience-TARGIT/Products/TARGIT-BI-Analytics/Features-Overview, they state that they do social analytics as well, these days there a lot of effort being directed towards getting valuable information from Unstrucutred data. The product which supports SQL Server can be downloaded from http://www.targit.com/en/Experience-TARGIT/Try-TARGIT/With-NAV-cubes.
I am have been spending my time trying to get through these products in terms of features, each one of them look impressive in terms of capabilities. In case anyone of you know more about these products please do drop a comment and share your experiences.
Monday, April 29, 2013
Analytics Reporting and Dashboards...
Recently I started a topic on Microsoft Business Intelligence forum in LinkedIn regarding having a common tool for doing SSAS cube reporting, relational reporting,charts and may be Pivot tables. It was a interesting discussion with comments raging from should we a need a all inclusive tool or have separate tools for different types of reporting. The reason i wanted to bring up this topic is because of the recent announcement of different tools from Microsoft starting with Powerpivot, then Powerview , GeoFlow and also more importantly placing Excel has a central BI tool for self service BI analytics. During this discussion I was sent a link to http://www.pyramidanalytics.com/. One of the much talked about topic in past was when Microsoft decided to end Proclarity and use PerformancePoint as a primary dashboard tool. There were lot of folks who were upset with that move and had been long yearning for a tool like Proclarity. Pyramid analytics has tool called bioXL, quoting from the company's website: Pyramid Analytics bioXL allows users to rapidly query both multi-dimensional and tabular OLAP cubes in SSAS and PowerPivot. Users can view trends, quickly isolate and investigate issues, drilling down to details as required or drill across ("dice") through data dimensions in a tool that reflects all the classic requirements of a cube viewer built with today’s technologies and application design concepts. I feel it has lot of features and potential to be used for Analytics reporting. Here is the link for http://www.pyramidanalytics.com/products/bioXL.aspx, they also offer another product such as bioPoint. In summary there are vendors like pyramidanalytics who have come up with a product to fill the void created by Proclarity.
Monday, April 22, 2013
Tableau and Microsoft BI...
One of recent trends in the space of BI has been the use of tablets to display dashboards and enable business managers to get to know important business metrics on the fly. Adding strength to the Mobile BI space has been the fact that the recent increase in the shipments of tablets , at the same time a drop in PC shipments. Presently business is looking to extend BI capabilities for its user base by wanting to get BI solutions deployed to different platforms/devices. Microsoft at this point has not really gotten into the Mobile Space domain yet but there is a way to extend Microsoft BI to Mobile. Here is a link below where in Jen Underwood from Tableau elaborates on how Microsoft BI on Mobile can be achieved. It is called Tableau and Microsoft BI for Mobile BI. I have extracted some key points from the blog:
1) Tableau’s touch-optimized, business intelligence is available across a wide array of mobile device types, browsers, and operating systems including Windows, iPad and Android - native apps and browser based. In the BYOD world we live in today, having wide device support is critical. Don't limit your mobile BI consumers to one device type.
2) Mobile users can view, edit or even author new visualizations on their favorite mobile tablets to not only view data but also ask on the fly questions in meetings or while on site to get immediate answers.
Read on further at the link below:
http://www.jenunderwood.com/blog.htm#TableauMobileBI
Friday, April 12, 2013
Excel - 3-D Data Visualization
There has been a ever increasing flow of Data visualization tools in the market. The tools become more effective if the data beneath the tools are clean and meaningful. The most recent version of Tableau has options to connect to Big Data sources and help users analyze such data, Big data has been a important space for a lot of vendors, of course there is a hype factor too. Microsoft recently announced a public preview of a tool called GeoFlow. As per Microsoft: “Geoflow” is a 3D visualization tool that helps users map, explore and interact with both geographic and chronological data, enabling discoveries that could be difficult to identify with traditional 2D tables and charts. Moreover, “Geoflow” emphasizes visual storytelling through collaborative features that show changes in data over time with beautiful screenshots and cinematic, guided video tours.
The output of Geoflow looks pretty slick, I would be interested in knowing how much value 3-D Data visualization provides (I guess the video tours would be very effective). Please check the link below to find out what GeoFlow has to offer, currently it is available along with Excel 2013.
http://www.bing.com/blogs/site_blogs/b/search/archive/2013/04/11/geoflow.aspx
I took the picture from the link above...
Tuesday, April 2, 2013
MultiDimensional Vs Tabular...
With the release of SQL Server 2012, SSAS has two modes one with MultiDimensional and the other with tabular. Depending on the business needs of the organisation one of the modes can be chosen or the two modes can exist on different servers. Well decisions would need to be made on what mode suits the organisation, one of the ways to approach this problem is that one could do a technological evaluation of the two modes and decide which one to choose. A better way to handle this would be is to use a decision matrix which would combine a good mix of business and technology needs. I would list them here, thanks to Devin Knight(From Pragmaticworks). Here are the following points.
1. The Time required to Develop the solution.
2. The type of Data Sources (What are the data sources is it going to be a relation database or flat files or web or xml).
3. The Ease of Query Language ( When using Multidimensional one needs to know MDX, when one uses tabular one needs to know DAX, this is kind of similar to excel based functions. Depending on the resources, what would be the learning curve, does the budget allow for staffing new resource who are skilled with either of the languages.)
4. Security (What are the security considerations for the solution to be developed, is security a top priority or not).
5. Presentation Options (What type of reports are required and how are they to be presented. What are the delivery modes for the reports for the end users)
6. Model Compatibility (How does either of the modes adhere to the data model available at hand, is there a good star schema database/dimensional model available or is the modelling of data very varied).
7. Scalability ( How scalable the solution is going to be, what is the data growth going be, by how much the source database going to grow, how much value the data is going to provide).
I find these 7 points cover a good range of questions that can be answered, it tries to incorporate a mix of business and technical factors. Hope the readers find these very helpful.
Thursday, March 28, 2013
SSAS 2012 - Tabular/Multidimensional...
I have SQL Server Analysis services 2008 (Multidimensional Mode) installed on my laptop. Of course with SSAS 2008 we had only one mode. With SSAS 2012 we had the introduction of tabular mode, i have tabular mode installed on my laptop. I was working on cube in the SSAS 2008 version in BIDS 2008 and was getting ready to deploy the cube. When i tried deploying the cube from BIDS, I got an error stating that Analysis services was not in traditonal mode but it was in tabular mode. In order to troubleshoot this error I connected to Analysis Services 2008, it connected fine.
Here is the snapshot of SSAS 2008 connection in SSMS.

 When one right clicks on the the top level analysis server and choose properties, the analysis services properties window shows up and one can see the server mode property which is set to Tabular. This clearly indicates the mode which was chosen while installing SSAS 2012. When SSAS 2012 Multidimensional is installed the server mode should be set accordingly. Another way of checking the SSAS 2012 install is to check the configuration file msmdsrv.ini. This is present in the path C:\Program Files\Microsoft SQL Server\MSAS11.MSSQLSERVER\OLAP\Config. In the .ini file there is a property called DeploymentMode, this would be set to 0 if it is multidimensional, 2 if it is Tabular, 1 is for Specifies Analysis Services instances that were installed as part of a PowerPivot for SharePoint deployment(MSDN, http://msdn.microsoft.com/en-us/library/gg471594.aspx).
Here is the snapshot of SSAS 2008 connection in SSMS.

In order to fix the deployment error, I stopped the SSAS 2012 Service and tried to deploy the SSAS 2008 cube in BIDS. This time the deployment worked fine, the database got created. It seems like when one has 2 installation of SSAS which are different versions and modes there seems to be a conflict while deploying the cube in BIDS 2008. In SSAS 2012 I had the tabular version installed, when i connected to SSAS 2012 using SSMS , please see the image below, it has only one folder called databases.

Monday, March 25, 2013
Report Caching-SSRS 2012
Report Caching is one of the features of SSRS. When does caching come into the picture, what drives the requirement of having report caching. One of the features of SSRS is that the data is queried each time the report is run, well this could turn out to be disadvantage since the user would be required to wait for the data to re be requeried each time a report is run. SSRS handles this problem by report caching. With many reports it is not essential to have up to the second data. The requirement could be well that the data source is updated once or twice a day. This would require users need data that is accurate as of the end of the previous business period, perhaps a month or a quarter. For the situations mentioned earlier it does not make sense to have data be requeried everytime a user requests a report. Report caching is the answer and the option can be turned on individually for each report on the report server. When the option is turned on the report server saves copy of the report in a temporary location the first time the report is executed. On the second and future executions of the report the same parameter values are used if any and the report server pulls the information necessary to render the report from the report cache rather than requerying the database. In most cases report caching is faster than the reports which are required every time.
In order to enable report caching one needs to get to the SSRS reporting portal and choose the particular report. Choose the Manage option and look for the properties page, in that there would be choice for Processing options. In the processing options page there would be a choice for :
Cache a temporary copy of the report. Expire copy of report after a number of minutes. One needs to check this option and set the number of minutes after which copy of report expires.
There is also an another option where one can set up a schedule after which a temporary copy of the report expires.
Report caching is a powerful feature which when used with the understanding of business needs, this can be very useful.
Thursday, March 14, 2013
SQL Server - Index Fragmentation...
One of the issues we run into when data starts growing in sql server tables is with the issue of Index fragmentation. One of the reasons this could happen is while designing the table and the type of indexes if proper thought and research is not done with the data going into the table(s). It is very important to understand the nature of data, the growth of data that can occur before loading the data into a table. It is also essential to come up the right type of indexes and fill factor. Sometime even with best case scenario index fragmentation can occur. One of the things to stay away from is to use to the standard maintenance plans that come out of the box with sql server. It is very essential to understand the server and database characteristics before designing a maintenance plans. The one thing that folks normally do is to drop and rebuild indexes on a fragmented table, there is a cost associated with rebuilding indexes.Before one decides to rebuild/reorganize indexes one should detect the level of fragmentation and see what kind of thresholds one has set up for the current database environment. One could use the following example SQL:
SELECT a.index_id, name, avg_fragmentation_in_percent
FROM sys.dm_db_index_physical_stats (DB_ID(N'TestDB'), OBJECT_ID(N'dbo.Customer'), NULL, NULL, NULL) AS a
JOIN sys.indexes AS b ON a.object_id = b.object_id AND a.index_id = b.index_id;
Once the average fragmentation percent is determined, one can decide to either reorganize or rebuild the indexes. One of the popular free tools available to do Index Defragmentation and other database maintenance activities is to use the following link:
http://ola.hallengren.com/
The scripts developed by ola have been very extensively used, it is popular in the SQL Server Community and has won lot of awards. Take a moment to check it out, it covers all editions of Microsoft SQL Server 2005, SQL Server 2008, SQL Server 2008 R2, and SQL Server 2012.
I had started a discussion in Linkedin on Index fragmentation in the Microsoft Business Intelligence group.
http://www.linkedin.com/groupAnswers?viewQuestionAndAnswers=&discussionID=223676112&gid=59185&commentID=127091755&goback=%2Egde_59185_member_223676112&trk=NUS_DIG_DISC_Q-ucg_mr#commentID_127091755.
There have been very good suggestions given by SQL Server experts for the question I asked. Please read through the above link mentioned in linkedin, gives one very good perspectives.
Tuesday, February 26, 2013
SQL Server-RowVersion
In SQL Server one of the recent additon has been change data capture a very useful and a powerful functionality to capture data changes in sql server. One of the other sdditions has been a column datatype called rowversion. The column type rowversion usually is used for situations where one needs to capture deltas with respect to the data. When i use the term delta what i mean is that let us take a scenario: Intially say we load 100 records into a table and then in the next day load around 10 records change, we could use the rowversion column to identify the rows that changed. What happens is that when a record is inserted or updated the rowversion value changes. Rowversion column type would eventually replace the timestamp column type in sql server. In case data is pulled from a source which is sql server based, the rowversion column type could be added to the source tables in oder to track which records changed. Here is a sample code which can be used: I used MSDN as a reference to get the sample code:
CREATE TABLE MyVer (myKey int PRIMARY KEY
,myValue int, RV rowversion);
GO
INSERT INTO MyVer (myKey, myValue) VALUES (1, 0);
GO
INSERT INTO MyVer (myKey, myValue) VALUES (2, 0);
GO
Here in the sample code above one can see that the column RV is defined as a rowversion data type. As per MSDN:
Rowversion Is a data type that exposes automatically generated, unique binary numbers within a database. rowversion is generally used as a mechanism for version-stamping table rows. The storage size is 8 bytes. The rowversion data type is just an incrementing number and does not preserve a date or a time. To record a date or time, use a datetime2 data type.
Once the table is created and data has been inserted, we can run the following statement and look at the values of the RV column:
myKey myValue RV
1 0 0x0000000000000A36
2 0 0x0000000000000A37
Now when the value of the column myValue is update in the table, the value of RV will change. In order to determine the latest value of rowversion in a database , one can use @@DBTS.
One can use the following code, to implement Optimistic concurrency control.
DECLARE @t TABLE (myKey int);
UPDATE MyTest
SET myValue = 2
OUTPUT inserted.myKey INTO @t(myKey)
WHERE myKey = 1
AND RV = myValue;
IF (SELECT COUNT(*) FROM @t) = 0
BEGIN
RAISERROR ('error changing row with myKey = %d'
,16 -- Severity.
,1 -- State
,1) -- myKey that was changed
END
In Summary the rowversion datatype can be used to track changes in the data in sql server.
Monday, February 25, 2013
SQL Server- Soft Skills...
The reason i choose this blog title was because of the numerous opinions raised by lot of folks in the industry stating that in order for one to be competent one needs to able to clearly articulate his ideas and communicate effectively. This blog post is going to highlight the importance of communication and presentation and use one of the blog posts written by a SQL Server Adam Machanic to substantiate this line of thought. The article written by Adam is excellent and very detailed. Please feel free to check out the link below to find out his thoughts on capturing attention. Here is the link below:
http://sqlblog.com/blogs/adam_machanic/archive/2013/02/22/capturing-attention-writing-great-session-descriptions.aspx?CommentPosted=true#commentmessage
Hope you find it useful just as I did by reading through the article. I will return to writing more detailed technical articles in my next post.
http://sqlblog.com/blogs/adam_machanic/archive/2013/02/22/capturing-attention-writing-great-session-descriptions.aspx?CommentPosted=true#commentmessage
Hope you find it useful just as I did by reading through the article. I will return to writing more detailed technical articles in my next post.
Thursday, February 21, 2013
SQL Server Statistics...
In the world of managing data and querying data in sql server databases one of the areas that require good understanding is the use and meaning of SQL Server Statistics. One of the key areas that is often discussed and required by many businesses is area of performance. There is a very good article on SQL Server statistics by Grant Fritchey called SQL Server Statistics Questions We Were Too Shy to Ask. Here is the link enclosed: https://www.simple-talk.com/sql/performance/sql-server-statistics-questions-we-were-too-shy-to-ask/. He lists very valid questions about statistics and provided detailed explanations.
Monday, February 4, 2013
Tabular Model SSAS 2012...
With SQL Server 2012 released and all the new features being evaluated and implemented one of the areas where there has been a lot of debate is between the SSAS model and the tabular model in the BI domain. The question being raised is which is better, also would tabular model replace the dimension model and many questions related to features and capabilities. I came across a very informative and interesting blog article by Marco Russo, a SQL Server BI expert and a excellent blog writer. In his article titled "Why to use #Tabular in Analysis Services 2012 #ssas " he writes about why tabular model should be given a serious look , to quote him regarding tabular model "You have to learn it deeper than a casual user, but you will found an unexplored territory of new data modeling and reporting opportunities". Here is the link to the blog article:
http://sqlblog.com/blogs/marco_russo/archive/2012/03/01/why-to-use-tabular-in-analysis-services-2012-ssas.aspx
http://sqlblog.com/blogs/marco_russo/archive/2012/03/01/why-to-use-tabular-in-analysis-services-2012-ssas.aspx
Tuesday, January 22, 2013
PowerPivot-DAX
Self service business analytics and in-memory analytics are a couple of streams that are going to see coverage this year based on various publications and technical magazines. I had written some basic blog posts about PowerPivot recently. One of the big weapons in the SSAS arsenal was the MDX language. Yes the MDX language has a quite a bit of a steep learning curve. The ones who acheived a certain level of mastery of MDX are/were able to extend the SSAS cubes built to provide various analytic information. In the same fashion in order to provide extended capabilities in PowerPivot, there is a new language available in the Powerpivot Domain Called DAX. The purpose of DAX is very similar to that of MDX in SSAS, the construct provides a lot of functions in order to calculate different type of aggregations,relations and averages. DAX provides the user with simple functions and that goes all the way to more complex functions.
When a user is in the PowerPivot window, for example where there are different worksheets with the Dimensions and the fact table, DAX functions can be used to get derived data. Let us say there is a worksheet called DimProduct which has all the columns in the DimProduct table. One can add a calculated column where in the user can type in a function called RELATED, this is a function available as part of the DAX construct. In this case one would type =RELATED(DimTable[ColumnName]), this function returns how the present Dimension table say DimProduct is related to the other dimension table listed in the RELATED function. As one can see here that it is possible to draw various relations between the tables, this could be very helpful in creating computed columns which can be later used in the PowerPivot Analysis that can be done using PIVOT tables.
When a user is in the PowerPivot window, for example where there are different worksheets with the Dimensions and the fact table, DAX functions can be used to get derived data. Let us say there is a worksheet called DimProduct which has all the columns in the DimProduct table. One can add a calculated column where in the user can type in a function called RELATED, this is a function available as part of the DAX construct. In this case one would type =RELATED(DimTable[ColumnName]), this function returns how the present Dimension table say DimProduct is related to the other dimension table listed in the RELATED function. As one can see here that it is possible to draw various relations between the tables, this could be very helpful in creating computed columns which can be later used in the PowerPivot Analysis that can be done using PIVOT tables.
Wednesday, January 16, 2013
T-SQL (INSERT)-SQL Server 2008
T-SQL has constantly evolved right from its very beginning and there are lot of new features that have been added to T-SQL over the years. I was working on a project where in I was creating a stored procedure and was writing INSERT sql. There was a need to capture the value inserted into a table and assign that value to a variable. In the INSERT t-sql statement there is a option called OUTPUT, what this clause does is it has access to the inserted table. This is very similar to how inserted table is available in Triggers. The purpose of the inserted table is hold the value that been just Inserted. For example a INSERT Statement with an output clause could look like the following:
INSERT INTO dbo.TestTable
(BatchId,
ServiceId)
OUTPUT inserted.BatchId,inserted.ServiceId
SELECT BatchId,
ServiceId FROM dbo.LookupTable WHERE ProcessName = @ProcessName.
In the above example the value of BatchId and ServiceId is being routed to inserted table with the columns BatchId and ServiceId. Now just having these in inserted table would not of much value, these need to be captured. In order to capture the values once can extend the INSERT statement in the following way:
INSERT INTO dbo.TestTable
(BatchId,
ServiceId)
OUTPUT inserted.BatchId,inserted.ServiceId INTO @out(BatchId,ServiceId)
SELECT BatchId,
ServiceId FROM dbo.LookupTable WHERE ProcessName = @ProcessName.
In the above example the values in the inserted table are being routed to a table variable with the 2 columns.
Once the statement is executed one can get the values from the @out table variable.
SELECT BatchId,ServiceId FROM @out.
The above feature gives a elegant way to capture information from a INSERT statement. The above set of queries were executed on SQL Server 2008.
INSERT INTO dbo.TestTable
(BatchId,
ServiceId)
OUTPUT inserted.BatchId,inserted.ServiceId
SELECT BatchId,
ServiceId FROM dbo.LookupTable WHERE ProcessName = @ProcessName.
In the above example the value of BatchId and ServiceId is being routed to inserted table with the columns BatchId and ServiceId. Now just having these in inserted table would not of much value, these need to be captured. In order to capture the values once can extend the INSERT statement in the following way:
INSERT INTO dbo.TestTable
(BatchId,
ServiceId)
OUTPUT inserted.BatchId,inserted.ServiceId INTO @out(BatchId,ServiceId)
SELECT BatchId,
ServiceId FROM dbo.LookupTable WHERE ProcessName = @ProcessName.
In the above example the values in the inserted table are being routed to a table variable with the 2 columns.
Once the statement is executed one can get the values from the @out table variable.
SELECT BatchId,ServiceId FROM @out.
The above feature gives a elegant way to capture information from a INSERT statement. The above set of queries were executed on SQL Server 2008.
Wednesday, January 9, 2013
In Memory Analytics - Part 2
In my earlier blog post i had written about In Memory Analytics and the tools provided by Microsoft which uses in memory analytics. This segment is becoming increasingly popular with new offerings from different companies. I guess with the cost of memory and disk space storage becoming cheaper there could be a plenty of in memory product offerings. One Such Product offering which is outside of Microsoft is from Salient , http://www.salient.com/our-technology/. To quote from the website:
"Salient has pioneered a new business intelligence paradigm that merges the unique thought process of each individual with advanced data visualization. This enables everyone – non-technical as well as technical – to interrogate the data in order to discern patterns, trends and outliers. Users can understand the relationships among activities, costs and outcomes – and discover root cause in seconds."
One of their offerings is Salient ETL which allows one to move from Design to Automation in 3 easy steps. It sounds very interesting.
From Design to Automation in 3 Easy Steps:
•Design based on business objectives
•Map source data to the logical design
•Automate updates of the data feeds
In Summary in the year 2013 there going to be lot of offerings in the In memory analytics and Big Data Domain.
Monday, January 7, 2013
SSIS - Audit Transformation...
In ETL operations/Design it is pretty obivious that there is a lot of need for auditing the data that is bought into Data Mart/Data Warehouse. In certain cases depending on when the data is fed into a Data mart lot of business transformations happen. While working on a SSIS package for one of my projects, i came across a task available in the Data flow of SSIS. The task is called Audit Data flow component. In order to use this component, one needs to attach this component to the out put of a say a input data source. What is essentially being done is, in addition to the input columns that is being derived from the input source, one can add additional ausit columns. For example: In my project I had a Flat file input source, so the first step was to drag and drop the flat file source into the Data flow and setup the path and the input columns. Once this was done, to the output of the flat file source I connected the Audit Data Flow component like the image show below:

Now in order to add the audit columns to the input data source, right click on the audit data flow comonent, the audit transformation editor opens up. In the editor I added the audit columns I needed to be part of the destination data, please see image below:

This Data flow component provides nice addition to capabilities of SSIS , in case one wants to add audit information the data to be stored in Data Mart/Warehouse.
Wednesday, January 2, 2013
SSAS - Cube Processing...
In SSAS there are different types of options available for Cube Processing. Each one of the Processing types have different uses. It would be good to understand the different types of processing for cubes.
Process Types Available in SQL 2005 / SQL 2008 / SQL 2008R2 Analysis Services:
ProcessFull : applies to all objects which means it discards the storage contents of the object and rebuilds them. It applies to descendants objects as well.
ProcessDefault
ProcessData
ProcessIndexes
ProcessUpdate
ProcessAdd: Applies to Dimensions and Partitions, it didn't existing in SSAS 2000. It essentially optimizes ProcessUpdate in scenerios where you are adding only new records to Dimension and facts.
ProcessClear: Discards the storage of the object, it applies to all objects and descendants objects
The ProcessUpdate option is a tricky option: It applies only to Dimension. It is the equivalent of incremental dimension processing in Analysis Services 2000. It sends SQL queries to read the entire dimension table and applies the changes—member updates, additions, deletions.
Since ProcessUpdate reads the entire dimension table, "How is it different from ProcessFull?" The difference is that ProcessUpdate does not discard the dimension storage contents. It applies the changes in a "smart" manner that preserves the fact data in dependent partitions. ProcessFull, on the other hand, does an implicit ProcessClear on all dependent partitions. ProcessUpdate is inherently slower than ProcessFull since it is doing additional work to apply the changes.
Depending on the nature of the changes in the dimension table, ProcessUpdate can affect dependent partitions. If only new members were added, then the partitions are not affected. But if members were deleted or if member relationships changed (e.g., a Customer moved from Redmond to Seattle), then some of the aggregation data and bitmap indexes on the partitions are dropped. The cube is still available for queries, albeit with lower performance.(with ProcessUpdate Flexible aggregations and indexes on related partitions will be dropped)
Thanks to Karan Gulati (From Microsoft SSAS/BI Group)
Subscribe to:
Posts (Atom)