One of the most commonly used tasks in SQL is related to counting records, as the data grows, counting records could become an expensive operation. Folks need to be aware of the environments where counts are being taken, especially while running in production. Performing counts in production could prove to be expensive. In the link given in the blog article below, SQL Server Expert/Writer Aaron Bertrand explores some of the techniques for doing counts and it s advantages/disadvantages:
http://sqlperformance.com/2014/10/t-sql-queries/bad-habits-count-the-hard-way.
There are different methods that are discussed:
COUNT(*).
Using System Views.
Putting table lock on the table whose counts are needed.
Change the isolation method.
Monday, November 3, 2014
Monday, October 13, 2014
Data Science/Data Scientist...
With the advent of Big Data technologies, the increased use of non structured data in business analytics, one of the roles that is beginning to rise in terms of demand is the Data Scientist. The area of study that a Data Scientist specializes is the area of Data Science. The huge amounts of data has called for more predictive analysis of the data instead of just focusing on the operational data. The power of predictive analytics if done right is that it gives the ability to a business to make better decision about future plans. For example how a company should target is products, what type of features does a product need to have to address the customer requirements. The emergence of data science has made Microsoft re prioritize the data mining features they incorporated into SSAS. All of the Data Mining algorithms are being re purposed into the Machine Learning tool in Microsoft Azure. I have explained about the Machine learning topic in my previous blog topic. In addition to Machine learning, to be make more effective usage of the tools available in Azure, it is important to understand the basics behind Machine Learning. Coursera offers a course on R Programming, it is free of cost and one can enroll by going to the https://www.coursera.org/ website. In case one is interested in going beyond learning the R language, Coursera has a complete Capstone course in Data science which includes learning about the algorithms behind data mining, getting introduced to machine learning apart from learning the R language. The Capstone course covers experimental design, statistical inference and regression models. This is one area which is growing very fast, so having a good foundation with courses listed above can provide a step into the predictive analytics world. One can also refer to the following link to understand the different types of algorithms in Data mining.
http://msdn.microsoft.com/en-us/library/ms175595.aspx
Data Science Capstone Course link:
https://www.coursera.org/specialization/jhudatascience/1?utm_medium=courseDescripTop
http://msdn.microsoft.com/en-us/library/ms175595.aspx
Data Science Capstone Course link:
https://www.coursera.org/specialization/jhudatascience/1?utm_medium=courseDescripTop
Monday, October 6, 2014
Hive, BI Best Practices, Machine Learning...
The SQL Saturday BI edition that
was held in Charlotte on October 4, 2014 had some interesting topics which I
attended. They were really insightful and provided me with some good
information that I would like to share. The first session by was given by Kevin Goode on topic of Introduction to Hive,
the session was really interesting with lots of questions and Answers. HIVE
basically is a layer on top of hadoop that allows users to write SQL language
type queries. HIVE in turn take the SQL queries and converts them to map reduce
jobs, they get executed the hadoop layer. The results are then provided back to
the user. HIVE uses a language called HQL which is a sqlvariant and has lots of
similarities like MySQL and Oracle Syntax. The query construct of HQL has
commands which very similar to Transact SQL. One of the main things that need
to keep in my mind is that HQL/HIVE does not great optimizer like sql server,
so while constructing the join statements in HQL one has to be very careful
about placing the tables in the join. HIVE?HQL is best suited for anaylytical queries and also it has no updates and deletes. The rule of thumb for now seems to be
that the smaller tables come first and then the larger tables. HQL/HIVE also
provided some type of execution plan but these are not as sophisticated as the
ones you see in SQL Server. The error messages provided by HQL when there
are issues are more java based, so it could a little bit of getting used while
working with HQL error messages. While working with HIVE/HQL the developer
should be aware of the type of data coming in and how it is partitioned. The
organization of data really helps optimizing the HQL queries. The results
provided by HQL can be used to feed a traditional datawrehouse system.One of
the areas where Hadoop is weak is in the area of security. Security is not very
structured in hadoop, the security has to be achieved using other bolt on
tools. Hortenworks is one of the leading distributors of hadoop and they
provide information regarding HQL. The frontend provided to connect to HIVE is
completely web based and users can use this tool to write HIVE queries using
HQL. Hortenworks is one of the big players in hadoop distributions: please
visit the hortenworks website here.
The
second session which attended was on tabular models. The topic was about how
build a tabular model using visual studio 2012 with SSAS 2012 tabular instance
installed. It was an informative topic as it bought out the differences between
SSAS traditional MDX based and tabular solutions. One of the key differentiators
is that SSAS is disk based and tabular is in memory and provide good speeds.
The limitation of the tabular model would be size of memory that can be used to
hold tabular models. Also with tabular you don't have writeback capabilities. The demo was pretty impressive, some of the steps done in
the demo very similar to how one would go about building SSAS cubes. The
topic was presented by Bill
Anton and his blog is located
at:
The third
session which attended was the most crowded of all the sessions. It was about
Best Practices for delivering BI solutions. The audience were all BI
professionals and also were with IT in various companies. SQL Server BI Expert James Serra provided a great session on best
practices. He started off with why BI projects fail, a Gartner study has
revealed that around 70% of BI projects fail. The fail factors ranges from lack
of expertise/experience, lack of proper communication, requirements and project
management. He highlighted the issues of clash between Business and IT over how
the solution should be delivered. One of the interesting aspects that was
mentioned was for technology to provide a clean data ware house and then build
some abstraction layers on top of the warehouse, once that is done allow the users
to build the users to utilize self-service BI solutions.Understand the difference between kimball and Inmon priciples, cappabilities of tabular vs Multidimensional, star schema vs relational. Please visit his
website for some great information on this topic and other aspects related to
Datawarehouse.
The final
session I attended was about Introduction to Microsoft Azure
Machine Learning, this topic was really exciting and informative. The
topic is basically about predictive analytics, the tools
provided by Microsoft as part of the Azure framework. Microsoft has a
group called Microsoft research which initially working on developing
algorithms for the Data mining product as part of SSAS. In the past few years
there has not been much push on data mining within SSAS. Recently
with Microsoft making a big push for cloud services offerings as part
of the Azure framework, all the Microsoft research are now being made
part of Machine learning using Microsoft Azure. He is a link that provided
a head start on the Machine learning topic: http://azure.microsoft.com/en-us/documentation/services/machine-learning/.
During the Session Bill
Carroll provided an
insightful demo of the machine learning framework within Microsoft Azure.
Azure provides a very nice framework for a developer to set up an
experiment. The workspace for setting up experiments look very similar to SSIS
workspace within visual studio. As part of the setting up experiment, one feeds
data to an algorithm based on the type of outcome that is needed, then the
model is trained, scored and evaluated, the model can be published. Once the
model is published, it can be called through an application using a web
service. There are code snippets available in C#, Python to call the web
service to execute the model. Some of the examples of machine learning are when
a user purchases a product in amazon, there are a list of recommended products
that are generated, list of recommended movies in Netflix based on
users watching preference, and these are some of real life examples, where
Machine learning is used.
Monday, September 15, 2014
SQL Teams - Working Together...
With so many products coming out of the gate, each product trying to address one part of the BI/Datawarehouse problems, one of the most important aspects is that the teams/folks involved in BI projects work together well. Since BI/Datawarehouse implementation involve cross team interactions , it becomes very vital that the team works together for the bigger picture. One of the classic areas of debate is between the developer and the DBA. Please read the following link about the pain points between developer & DBA, and how these can be resolved. I found this article to be very informative and could provide some tips...the article has been written by David Poole, a Data Architect.
https://www.simple-talk.com/opinion/opinion-pieces/dbas-vs-developers-a-sad-tale-of-unnecessary-conflict/?utm_source=ssc&utm_medium=publink&utm_content=dbavsdev
https://www.simple-talk.com/opinion/opinion-pieces/dbas-vs-developers-a-sad-tale-of-unnecessary-conflict/?utm_source=ssc&utm_medium=publink&utm_content=dbavsdev
Thursday, September 11, 2014
SQL Server 2014 - Top Features...
Here is a summarised list of new features in SQL Server 2014 that could be worth an upgrade. There are still a lot of customers on SQL Server 2008, they could take the path straight to 2014 instead of going to SQL Server 2012.
1. New In-Memory OLTP Engine
2. Enhanced Windows Server Integration
3. Enhancements to AlwaysOn Availability Groups
4. Enhancements to Backups
5. Updateable ColumnStore Indexes
6. SQL Server Data Tools for Business Intelligence
7. PowerBI for Office 365 Integration
The New-In Memory OLTP Engine and ColumnStore Indexes are bound to attract the OLTP and OLAP Customer base. Please read through these feature details in the following link. The link gives a more detailed description of the features.
http://sqlmag.com/sql-server-2014/sql-server-2014-important-new-features.
Monday, September 8, 2014
SQL Saturday 2014...
SQL Saturday sessions are in full swing, these are one day events with lots of different topics to listen to and learn from. The SQL Server Saturday BI Edition is going to held in Charlotte on October 4, 2014. The Charlotte BI Group is excited to bring this event to you. The list of topics include: ETL, Data Visualization, Self-Service BI, Data Quality, Master Data Management, OLAP, Big Data, SharePoint, Data Management, as well as plenty for the SQL Server Administrators out there! .
Location: Central Piedmont Community College (CPCC), Levine Campus, 2800 Campus Ridge Road, Matthews, NC 28105 (located in South Charlotte) .
SQL Saturday Link for Charlotte : http://www.sqlsaturday.com/330/eventhome.aspx.
Location: Central Piedmont Community College (CPCC), Levine Campus, 2800 Campus Ridge Road, Matthews, NC 28105 (located in South Charlotte) .
SQL Saturday Link for Charlotte : http://www.sqlsaturday.com/330/eventhome.aspx.
Tuesday, August 26, 2014
SPLUNK...Operational Data
In the Data warehousing and BI world, there are numerous instances where we get text files/excel files as data inputs to a datawarehouse/data mart. As part of the handshake between the Source systems and traget systems we receive log files. These log files would contain summary information about the data being sent. Using the log file the target system would load validate the data being received, once data is validated the loading process would start. There are numerous techniques of doing this type of validation. In certain organizations there could be numerous processes that produce log files to other downstream systems that would need to consume the data. In addition to the log files there are also numerous amounts of machine data produced by different systems and applications that would be need to be monitored so that this type of information can be leveraged by organizations for various business groups. In order to mange this type of monitoring there is a tool provided by SPLUNK, web site: www.splunk.com. The company provides different types of monitoring tools: tools for operational intelligence, Cloud, BigData and Business Analytics. Please review the links below: for additional details.
http://www.splunk.com/view/operational-intelligence/SP-CAAAFVM
http://www.splunk.com/solutions
Tools like SPLUNK provide business an opportunity to make sense of the operational/machine data and leverage positive results.
http://www.splunk.com/view/operational-intelligence/SP-CAAAFVM
http://www.splunk.com/solutions
Tools like SPLUNK provide business an opportunity to make sense of the operational/machine data and leverage positive results.
Thursday, August 7, 2014
SSIS Parameters-SQL Server
Given the nature of today's ETL operations there are lot of complex SSIS packages being built to handle different aspects of Data Processing. One of the key concepts involved with multiple SSIS packages is the passing of parameters between the packages. My friend Pinal Dave, a SQL Server Expert had bought out a excellent post in his famous SQL Server blog. Here is the link to the article.
http://blog.sqlauthority.com/2014/08/07/sql-server-ssis-parameters-in-parent-child-etl-architectures-notes-from-the-field-040/?utm_source=feedburner&utm_medium=feed&utm_campaign=Feed%3A+SQLAuthority+%28Journey+to+SQL+Authority+with+Pinal+Dave%29.
Enjoy reading the article very informative...
http://blog.sqlauthority.com/2014/08/07/sql-server-ssis-parameters-in-parent-child-etl-architectures-notes-from-the-field-040/?utm_source=feedburner&utm_medium=feed&utm_campaign=Feed%3A+SQLAuthority+%28Journey+to+SQL+Authority+with+Pinal+Dave%29.
Enjoy reading the article very informative...
Friday, August 1, 2014
Data Integration
One of the areas that i have increasingly working on these days is the area of data integration. Business/Companies have a variety of database systems and it is very rare that you find companies running out of one database system/platform. There is an increasing need for different database systems/architectures to co-exist. The battle at times becomes very political to replace one database/BI platform with another one in its entirety. This is where data integration comes in and there are lot of tools available in the ,market today in this space. The Gartner report for Data integration tools is available now. Based on the report Microsoft is in the Challengers quadrant, the data integration tools that encompass the Data integration framework as per the study are SSIS and BizTalk server. I have used a lot of SSIS but very rarely i have come across Biztalk servers is my projects. The reason why Microsoft is in in the challengers space is because of the lack of breadth of functionality, quoting the report: " Although Microsoft addresses core data integration requirements, non-bulk/batch data integration styles remain a gap in its offering relative to market demand. Microsoft's product strategy for aligning capabilities to data movement, transformation and orchestration (referred to as "information production") aims to broaden its market positioning". The leaders in the Data Integration Space are 1. Informatica 2. IBM 3. Oracle. Oracle's main data integration tools are Oracle Data Integrator (ODI), Oracle Data Service Integrator, Oracle GoldenGate and Oracle Warehouse Builder (OWB). One of the weakness in the Oracle integration suite is lack of skill set available with the set of tools mentioned above. Companies like Cisco(Composite Studio) and Actian fall in the visionaries category. Cisco is a new incumbent in the data information management technologies market. Adeptia and Syncsort fall in the niche players category. For the Complete report, please use the link below:
http://www.gartner.com/technology/reprints.do?id=1-1Y495V6&ct=140724&st=sb&mkt_tok=3RkMMJWWfF9wsRonv6TNe%252B%252FhmjTEU5z16e4qWqa3lMI%252F0ER3fOvrPUfGjI4DT8pgNK%252BTFAwTG5toziV8R7HNJc160s8QXBjm
The domain of data integration encompasses a wide variety of services which are increasing by the year.
http://www.gartner.com/technology/reprints.do?id=1-1Y495V6&ct=140724&st=sb&mkt_tok=3RkMMJWWfF9wsRonv6TNe%252B%252FhmjTEU5z16e4qWqa3lMI%252F0ER3fOvrPUfGjI4DT8pgNK%252BTFAwTG5toziV8R7HNJc160s8QXBjm
The domain of data integration encompasses a wide variety of services which are increasing by the year.
Wednesday, July 16, 2014
Nice to Have Books...
With growing online content, downloadble books available for business intelligence, data warehousing, it is always go to have books handy on one's book shelf. When one has to read through several pages sometimes a book becomes very handy. Here is a blog written by SQL Server expert James Serra on what would be the nice to have books, it covers the areas of Data warehouse, Business Intelligence, Master Data Management and Consulting. Please refer to the link below: the list is pretty exhaustive.
http://www.sqlservercentral.com/blogs/jamesserra/2014/07/16/it-books-that-should-be-on-your-shelf/
Some of the books which I have are Ralph Kimball book on data warehousing and Microsoft Reporting Services 2012.
http://www.sqlservercentral.com/blogs/jamesserra/2014/07/16/it-books-that-should-be-on-your-shelf/
Some of the books which I have are Ralph Kimball book on data warehousing and Microsoft Reporting Services 2012.
Monday, June 30, 2014
Renaming SYSSSISLOG table...
In SSIS we have different ways of logging the progress of the SSIS package, these can be tracked in files or can be done with a table. One of the popular ways of auditing the SSIS package is using a SQL Server table. The table that is used is dbo.sysssislog table, this table is created by default when choosing the Logging of SSIS package to be done via SQL Server. There was a comment/question by one of the readers of my blog, as to whether the table can be renamed into something more meaningful. The answer is yes, here are the steps listed: The one thing to watch out for is to modify the sp_ssis_addlogentry stored procedure to point to the new renamed audit table.
1. Click the table dbo.sysssislog in the database that has the table.
2. Right click on the table and rename the table to what the new name should be.
3. In the SQL Server Management studio expand programmability and choose Stored procedures.
4. Right click on the sp_ssis_addlogentry stroed procedure and choose modify.
5. Replace the table dbo.sysssislog in the stored procedure with the new renamed table.
6. Press F5 to recompile the stored procedure.
7. This audit table is present in the SQL Server 2008 and SQL Server 2012 database systems.
8. In SQL Server 2005 databases, the table is called sysdtslog90.
9. The stored procedure is called sp_dts_addlogentry, it would be in the stored procedures folder in SSMS.
Tuesday, June 3, 2014
Hadoop-DMXExpress
Hadoop is definitely making its presence felt in big organizations, it is being used as a complement to the existing traditional BI investments made by the companies. One of the projects which i am following, there is a very measured approach to getting hadoop into the ecosystem and making sure there is good value proposition for the company. Understanding the concepts involved with Hadoop and the infrastructure that goes with it will provide a good understanding of the concepts. There has been lot of talk about folks need to know java to work with hadoop. In certain cases finding such resources can cost a lot of money in the sense good java resources are expensive. Anyways I don't want to get into that debate. One of the key functions that is involved working with hadoop/Big data is ETL. We still need to be able to move the data from the HDFS/map reduce outputs to say other traditional data warehouses, basically perform data integration. One of the tools that is available in the market today is from a vendor called Syncsort (http://www.syncsort.com). They have a tool called DMX Express which is very useful for performing ETL/Data integration functions. As per the vendors website, DMX Express "Accelerates Data Integration performance, eliminate manual coding, and reduce total cost of ownership to capitalize on the opportunities of Big Data". There is another tool called DMX-h, this tool as per the vendor:"From comprehensive connectivity and optimized sort capabilities, to point-and-click interfaces for developing MapReduce jobs, DMX-h provides everything organizations need to successfully deploy ETL in Hadoop. No coding, no scripting, no tuning; just smarter data integration". I had the opportunity to see the demo of DMX Express the user interface of the tool looks similar to the tasks we have in SSIS. Folks who have worked with SSIS should find the transition a lot easier. Also as per the person who was doing the demo there is no prerequisite of knowing Java, the tool takes care of what has been done by writing Java classes.
DMX Express link: http://www.syncsort.com/en/Products/DMX/DMX-Overview.
DMX Express link: http://www.syncsort.com/en/Products/DMX/DMX-Overview.
Tuesday, May 13, 2014
Data Analytics-SQL Server...
One of the more popular term that is doing rounds these days is the term called Data Scientists. This seems to have emerged alongside the growth of Big Data. As part of the Data scientists role it is expected to have a good knowledge of statistical tools and data modelling concepts using mathematics plus exposure tools like SAS,SPSS and R. One of the tools i came across recently which is being used in the Big Data world is R. Today I had the opportunity to attend a session organized by PASS on SQL Server and R, this was presented by Tomaz Kastrun. The session focused on how R can be used with SQL Server to perform Data Analysis. As per Tomaz:
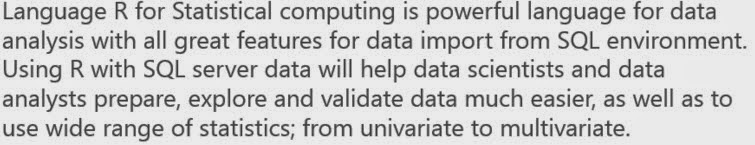
"The Language R is a powerful language for data analysis with all the great features for data import from SQL Server Environment". The Language R along with SQL Server data would be a powerful tool for data scientists to use wide range of statistics. There are statistical functions in SQL Server as part of T-SQL but they tend to be more of the standard/simplistic statistical functions. In case we have to use more complex statistical functions then the T-SQL Code would get longer and more complex which would lead to maintainability issues. This is where tools like R Language come in which can be used with SQL Server to produce very effective results. Here is a definition/purpose of R-Language (which was presented as par of the topic).
 In order for the SQL Server Integration with R, one would need the following:
SQL Server
R-Language (needs to be installed) - This is available at the site: http://www.rstudio.com
Data (of Course), it would be good to cleanse the data before using for analysis with R.
The topic presented shows different opportunities that exists to leverage current tools like SQL Server and combine them with a powerful statistical language like R. This provides different analytical capabilities for the Data Scientists/Developers.
"The Language R is a powerful language for data analysis with all the great features for data import from SQL Server Environment". The Language R along with SQL Server data would be a powerful tool for data scientists to use wide range of statistics. There are statistical functions in SQL Server as part of T-SQL but they tend to be more of the standard/simplistic statistical functions. In case we have to use more complex statistical functions then the T-SQL Code would get longer and more complex which would lead to maintainability issues. This is where tools like R Language come in which can be used with SQL Server to produce very effective results. Here is a definition/purpose of R-Language (which was presented as par of the topic).
SQL Server
R-Language (needs to be installed) - This is available at the site: http://www.rstudio.com
Data (of Course), it would be good to cleanse the data before using for analysis with R.
The topic presented shows different opportunities that exists to leverage current tools like SQL Server and combine them with a powerful statistical language like R. This provides different analytical capabilities for the Data Scientists/Developers.
Wednesday, May 7, 2014
SQL Server 2014 and Tempdb...
One of the challenges faced in SQL Server development is how to handle tempdb and make sure that temp tables are not causing excessive disk i/o. Then came table variables and there have been lot of posts about which is better (table Variables vs temp tables). Now in SQL Server 2014 there has been some kind of improvement for tempdb. Please read the blog post below from SQL Server Expert Kendra Little:
http://www.brentozar.com/archive/2014/04/memory-ssd-tempdb-temp-table-sql-2014/
One thing to note is that tests were run on machines which had storage on SSD. The above blog article is built upon the original blog post listed below:
http://blogs.msdn.com/b/psssql/archive/2014/04/09/sql-server-2014-tempdb-hidden-performance-gem.aspx. To quote from the original blog article:
"Prior to the SQL Server 2014 change the select into may have written all the pages accumulated to disk. The SQL Server 2014, eager write behavior, no longer forces these pages to disk as quickly as previous versions".
Wednesday, April 23, 2014
Data Virtualization...
With companies/business having different types of data marts/datawarehouses there is a fear that these could become independent silos and could not provide value to the business as a whole. There has been lot of resources(Time,Money,People) being invested in building a datawarehouse/data marts. The business would like to get value from the disparate datawarehouses/data marts, so the concept that has been in play for quite a while is Data Virtualization. Data Virtualization could be defined as process of building a agile data layer for easy data access and delivery. This is also sometimes referred to as the data abstraction layer so that users can get access to data quickly. Having defined Data Virtualization, where does one use this concept: Here are some of the situations where Data Virtualization could be used.
1. Data Federation - Scenario: A application requires data from multiple incompatible data sources.
(Example: Federated Views, Virtual Data Marts)
2. Data Warehouse Extension: The Datawarehouse does not contain the required data to create reports (Example: Datewarehouse Extension)
3. Data Virtualization - Build a Agile Data layer for easy data access.
4. Big Data Integration: How to combine Big Data with traditional data for analysis (Example: Hadoop)
5. Cloud Data Integration: Need to integrate systems on site with the Applications running in the cloud (Example: SaaS Application Integration)
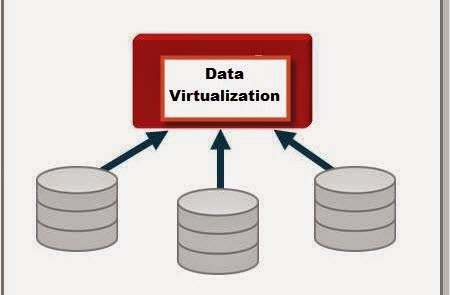 Based on the scenario and type of question we are trying to answer, Data Virtualization could be a solution. The concepts described here were based on a article related to the Composite , a data virtualization/Integration tool from Cisco (http://www.compositesw.com/data-virtualization/).
1. Data Federation - Scenario: A application requires data from multiple incompatible data sources.
(Example: Federated Views, Virtual Data Marts)
2. Data Warehouse Extension: The Datawarehouse does not contain the required data to create reports (Example: Datewarehouse Extension)
3. Data Virtualization - Build a Agile Data layer for easy data access.
4. Big Data Integration: How to combine Big Data with traditional data for analysis (Example: Hadoop)
5. Cloud Data Integration: Need to integrate systems on site with the Applications running in the cloud (Example: SaaS Application Integration)
Wednesday, April 16, 2014
SQL Server 2014-EBook
With SQL Server 2014 being released, there are lot of lectures/talks being organised by SQL PASS for folks who want to get a understanding of what is available in SQL Server 2014. There is a free ebook written by Ross Mistry and Stacia Misner on SQL Server 2014. The eBook is titled "Introducing Microsoft SQL Server 2014 Overview". The ebook is around 116 pages and contains primarily 2 Parts: 1. Database Administration, Part 2: Business Intelligence Development.
The Part 1 has 3 Chapters, these chapters highlight the 1. SQL Server 2014 Engine Enhancements, 2. In-Memory Features, 3. High Availability, Hybrid Cloud and backup enhancements.
The Part 2 Focuses on the BI related enahnacements available in SQL Server 2014. The 3 Main Areas focused on are: Chapter 4 on Self Service BI, Chapter 5: on Power BI, Chapter 6: Big Data Solutions. All of the chapters describe the future BI solutions that are going to be available. The Chapter 6 dwells into the Microsoft Big Data Framework HDInsight. Here is the link for the eBook:
http://www.microsoftvirtualacademy.com/ebooks
Thursday, April 10, 2014
Tabular Data Model - Step by Step
My friend and SQL Server Expert, Pinal Dave has written a blog article about the SSAS tabular data model. In this article he takes you step by step on creating a Tabular Data Model Project in VS 2010.
Please take a look when you get a chance...
http://blog.sqlauthority.com/2014/04/08/sql-server-what-is-ssas-tabular-data-model-and-why-to-use-it/?utm_source=feedburner&utm_medium=feed&utm_campaign=Feed%3A+SQLAuthority+%28Journey+to+SQL+Authority+with+Pinal+Dave%29
Please take a look when you get a chance...
http://blog.sqlauthority.com/2014/04/08/sql-server-what-is-ssas-tabular-data-model-and-why-to-use-it/?utm_source=feedburner&utm_medium=feed&utm_campaign=Feed%3A+SQLAuthority+%28Journey+to+SQL+Authority+with+Pinal+Dave%29
Monday, April 7, 2014
AS-IS - TO BE...Business Process Management
When I work/worked on BI projects, one of main reason for initiating a project is to make a process better for the business and provide increased value to business in terms of revenue/profits. A good analysis and design of the business requirements would yield very good results. One of the methodologies i have been exposed to as part of Business Process Management is the AS IS TO BE analysis method. As part of this method the first step that is to be done is to understand the current process which is called as the AS IS State. Here one builds a flow diagram of the present system/process in place. Once this completed, the analysis of the current process takes place. In this step any possible flaws/deficiencies are identified, also any possible opportunities to optimise the process is also discussed/documented. The goal here is to identify steps that improve the overall process and provide Business value. Once this step is completed, then we move on to the TO BE stage where the proposed/improved process is documented. In this step the improvements/optimisations are captured. A walk through of the proposed process is performed and made sure that the design can be implemented. There are different tools to perform the AS IS-TO BE methodology. One of the tools available is from visual paradigms, here is the link http://www.visual-paradigm.com/. The specific product that helps with the AS-IS - TO-BE Process is Logizian: Here is the description of the tool from the web site at a high level. One of the reasons to write a blog post on this topic was to highlight the importance of analysis and design in a project where BI solutions are going to be implemented.
http://www.visual-paradigm.com/product/lz/
http://www.visual-paradigm.com/product/lz/
Logizian - BPMN 2.0 Business Workflow Design Software
Easy-to-use and cross-platforms business process design tool that supports business process modeling with Business Process Modeling Notation (BPMN) 2.0, Data Flow Diagram (DFD), decision table and organization chart. Logizian supports also advanced business modeling features like to document working procedures for workflow elements, animating business process diagram, process simulation, reports generation and publishing workflow design to website.
Tuesday, April 1, 2014
SQL Server 2014 - Evaluation...
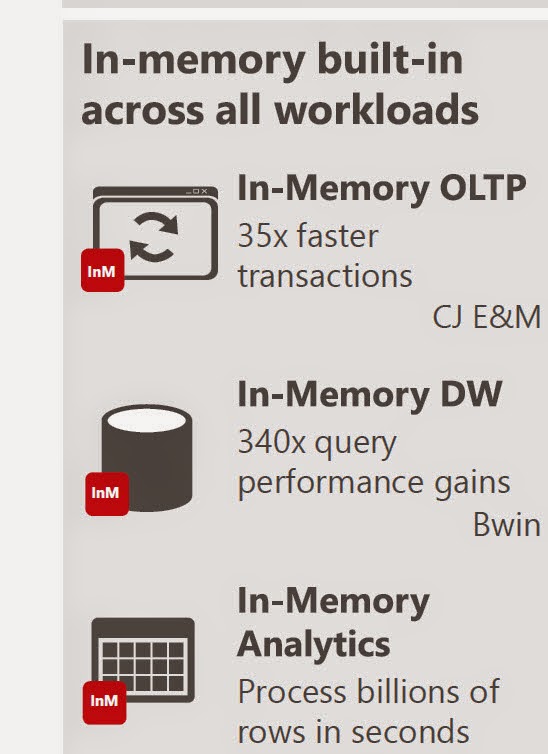
As folks are getting comfortable SQL Server 2012, In some cases I have heard that users want to bypass SQL Server 2012 and upgrade straight to SQL Server 2014 from SQL Server 2008. One of the big attractions is use of in memory technologies across the OLTP, Data warehousing and BI platforms. There not been much of improvements in SSIS and SSRS but SSAS/BI has got some new features. Please check the following link for all the features and the product itself.
http://www.microsoft.com/en-us/server-cloud/products/sql-server/#fbid=l3BkTG6tymf.
The image below was taken from the SQL Server 2014 Data Sheet...which talks about In memory across all workloads.
Hope one of these days I will get to install and evaluate SQL Server 2014.
http://www.microsoft.com/en-us/server-cloud/products/sql-server/#fbid=l3BkTG6tymf.
The image below was taken from the SQL Server 2014 Data Sheet...which talks about In memory across all workloads.
Hope one of these days I will get to install and evaluate SQL Server 2014.
Friday, March 28, 2014
Gartner 2014 Report - BI and Analytics Platforms...
The Gartner report for 2014 related to the Business Intelligence and analytics platform is out, as expected the number of vendors competing in the BI and Analytics space continues to grow. There are niche vendors continuing to enter the market space, at the same there are some vendors who have made it to the leaders quadrant. The vendors were evaluated across 17 categories which were divided into 3 main areas:
Tableau,Qilk,Microsoft,SAP,SAS,IBM,Oracle,Tibco Software,MicroStrategy and Information Builders. Since i use Microsoft suite of products the most, areas of concerns that has been listed are, Interactive visualizations, metadata management and Mobile BI support. As per the report Microsoft is trying to handle the Mobile BI space by using Power BI. Currently Microsoft BI products seemed to be most used in the Enterprise and Small business world the most. One of the challenges that Microsoft faces I feel is cross product integration, we have the traditional Microsoft BI stack on one hand, the Office/Power BI suite on the other, to add to the mix we also have Sharepoint driven BI capabilities. How do these different versions of BI products from Microsoft Co-Exist? At the same time Microsoft is depending on cloud based BI offerings to reduce complexity for smaller companies.
There were other vendors who have good mention with respect to the leader's quadrant: They are:
Tableau
TIBCO Software
Qilk
The concerns for the above three vendors were mainly in the areas of Customer Support and sales. For Qilk as per the report there were mixed opinions about whether product is enterprise ready or not.
In the report there was mention of two cloud based BI vendors:
Birst
Birst's BI platform is primarily a cloud-based offering. It includes a broad range of components, such as data integration, federation and modeling, a data warehouse with a semantic layer, reporting, dashboards, mobile BI and a recently announced interactive visualization tool.
GoodData
GoodData is a cloud BI and analytics specialist. It provides a range of front-end BI capabilities and packaged analytic applications that complement its comprehensive cloud and on-premises source data integration and cloud-based data warehouse platform.

- Information Delivery
- Analysis
- Integration
Tableau,Qilk,Microsoft,SAP,SAS,IBM,Oracle,Tibco Software,MicroStrategy and Information Builders. Since i use Microsoft suite of products the most, areas of concerns that has been listed are, Interactive visualizations, metadata management and Mobile BI support. As per the report Microsoft is trying to handle the Mobile BI space by using Power BI. Currently Microsoft BI products seemed to be most used in the Enterprise and Small business world the most. One of the challenges that Microsoft faces I feel is cross product integration, we have the traditional Microsoft BI stack on one hand, the Office/Power BI suite on the other, to add to the mix we also have Sharepoint driven BI capabilities. How do these different versions of BI products from Microsoft Co-Exist? At the same time Microsoft is depending on cloud based BI offerings to reduce complexity for smaller companies.
There were other vendors who have good mention with respect to the leader's quadrant: They are:
Tableau
TIBCO Software
Qilk
The concerns for the above three vendors were mainly in the areas of Customer Support and sales. For Qilk as per the report there were mixed opinions about whether product is enterprise ready or not.
In the report there was mention of two cloud based BI vendors:
Birst
Birst's BI platform is primarily a cloud-based offering. It includes a broad range of components, such as data integration, federation and modeling, a data warehouse with a semantic layer, reporting, dashboards, mobile BI and a recently announced interactive visualization tool.
GoodData
GoodData is a cloud BI and analytics specialist. It provides a range of front-end BI capabilities and packaged analytic applications that complement its comprehensive cloud and on-premises source data integration and cloud-based data warehouse platform.
Tuesday, March 25, 2014
SQL Scripts...
As a Developer, I have always loved writing scripts to automate tasks in SQL Server. They come in really Handy especially for DBA's and Developers alike. When I used to work as a DBA for a product development firm i had to create scripts as part of installation and provide utility scripts for clients. With the constant evolvement of SQL Server there are lot of areas where scripts can come in handy. Here is a blog by DBA On the Go, where in the some of the useful and quality scripts have been compiled:
http://www.dbaonthego.com/2014/03/my-favorite-free-scripts.html. I am a big fan of Ola hallengren's scripts, please check out the blog link above.
http://www.dbaonthego.com/2014/03/my-favorite-free-scripts.html. I am a big fan of Ola hallengren's scripts, please check out the blog link above.
Monday, March 17, 2014
Cloud Services...
I was on a emergency trip to take care of my father, during the flight met some individuals who are offering different types of cloud based services for different types of companies. They were were upbeat about the adoption of cloud based technologies. With Microsoft Satya Nadella stating the emphasis on cloud based and mobile offerings, this is a space to watch out for. I am enclosing a link on a demo of Azure by MVP TroyHunt:
http://www.troyhunt.com/2014/03/the-worlds-greatest-azure-demo.html. He very nicely lists out the 14 different steps required to set up Azure and has provided a video as well.
http://www.troyhunt.com/2014/03/the-worlds-greatest-azure-demo.html. He very nicely lists out the 14 different steps required to set up Azure and has provided a video as well.
Wednesday, February 19, 2014
Schema on Read vs Schema on Write...
There are more and more case studies/examples of Big data implementations. Big data is not suitable for all scenarios. Where Big data concepts are applicable, it is important to know the difference between:
Schema on Read and Schema on Write: The differences between the two was captured from a presentation/discussion on Big data by Oracle. Regardless of SQL Server or oracle the concept described below is very important to understand.

The main focus on the difference between the 2 is that when is the value realized faster, of course there could be debates surrounding this concept.
Schema on Read and Schema on Write: The differences between the two was captured from a presentation/discussion on Big data by Oracle. Regardless of SQL Server or oracle the concept described below is very important to understand.
The main focus on the difference between the 2 is that when is the value realized faster, of course there could be debates surrounding this concept.
Monday, February 10, 2014
Power BI - Continued...
Today Microsoft announced the availability of Power BI for Office 365. Power BI recently has been gaining a lot of traction, I attended a session with SQL PASS on 24 hours of BI where in one of the lectures was on Power BI and its components. Please use the following link for More details.
http://www.microsoft.com/en-us/powerbi/default.aspx#fbid=4fJwgwe08Zn
As per Microsoft: a cloud-based business intelligence service that gives people a powerful new way to work with data in the tools they use every day, Excel and Office 365. With Excel you can now discover, analyze, and visualize data like never before to find valuable business insights. With Power BI for Office 365 you can easily deploy a cloud-based BI environment. Couple of features that I would like to mention here:
Quickly create collaborative BI sites – enable anyone to quickly create a collaborative BI site to share workbooks containing data and insights.
Keep reports up to date with scheduled data refresh.
Please visit the the link mentioned above to know more about Power BI and it s capabilities.
In order to understand the differences between Power BI and tableau: Please read the article below written by BI Expert Jen Underwood, very detailed analysis...
http://www.jenunderwood.com/2014/01/02/understanding-the-differences-microsoft-power-bi-and-tableau/
http://www.microsoft.com/en-us/powerbi/default.aspx#fbid=4fJwgwe08Zn
As per Microsoft: a cloud-based business intelligence service that gives people a powerful new way to work with data in the tools they use every day, Excel and Office 365. With Excel you can now discover, analyze, and visualize data like never before to find valuable business insights. With Power BI for Office 365 you can easily deploy a cloud-based BI environment. Couple of features that I would like to mention here:
In order to understand the differences between Power BI and tableau: Please read the article below written by BI Expert Jen Underwood, very detailed analysis...
http://www.jenunderwood.com/2014/01/02/understanding-the-differences-microsoft-power-bi-and-tableau/
Tuesday, February 4, 2014
JOINS (Hash,Merge,Nested Loop)
As a developer one definitely would have encountered performance issues with queries run on SQL Server database. Queries that were working during the initial design phases start to slow down once projects are deployed to production. There could be several factors affecting the performance of a query, it is essential for one to understand the execution plans generated by the sql server optimizer. It is important to know what types of joins are being utilised by the optimizer and why. The joins referred to in this article are related to Hash, Merge and Nested Loop joins. The focus is on what happens behind the scenes when INNER JOIN/ OUTER JOIN queries are executed. In order to see the execution plan, one use the Include Execution Plan option in SSMS, once the query is completed, the Execution Plan is displayed in the results tab. Now lets look at what each of the joins mean.
MERGE JOIN: Match rows from two suitably sorted input tables exploiting their sort order.
HASH MATCH(Hash Join): Using Input row from the top input table to build a hash table, and each row from the bottom input table to probe into the Hash table, outputting all matching rows.
NESTED LOOP: For Each row in the top(outer) input, scan the bottom (inner) input , and output matching rows.
The following article might be dated, but it has a very relevant information with a test performed with different data set sizes and indexes: This article was written by Muthukkumaran kaliyamoorthy.
http://www.sqlserverblogforum.com/2011/10/merge-join-vs-hash-join-vs-nested-loop-join/
One can take the examples provided in the article and try to apply it to one's database and see the difference in execution plan. The difference in the joins chosen by the optimizer depends on the data size, indexes of each table involved in the join. Hope the referenced article helps developers to figure performance issues related to joins and enhance the queries better.
Friday, January 31, 2014
BI - Spotfire,Cognos...
There has been continuous growth of vendors offering BI solutions which cover varying aspects of business intelligence. There has been a lot of emphasis on visualization, offering BI on mobile devices and making reports more interactive. One of the recent products which i got to look at were Spotfire and Cognos. Spotfire is a BI tool offering from TIBCO, Cognos is from IBM. SQL Server BI stack has been facing challenges from different vendors, Microsoft also has been growing its offerings. Coming to the 2 products Spotfire and Cognos, one of the common pitches I heard from these 2 vendors is that both of them offer zero footprint solutions, both of them are web driven tools and the user gets to access different modules available in the products. How they have pitching against the SSRS solution from Microsoft is that, with SSRS one needs to a have a client install of Visual Studio or BIDS in order to perform report development. Cognos for example has the following components with in their product like Analysis Studio (which geared more towards cube building), Query Studio and Report Studio. With respect to Spotfire i was able to get information only on Reporting and Visualization. The capabilities from Spotfire with respect to Dashboard looked impressive. Spotfire focused on how users can take advantage of Advanced analytics without requiring client side installs and providing more power to Business users.
The next feature which was demonstrated was a concept called Location Analytics, this would allow users to build reports based on maps and would provide details with respect to Cities, roads and political boundaries. One of the features highlighted was the concept of Automatic Offline Geocoding, which seems like a neat concept, need to dwelve on these features more to get a understanding of the benefits.

The next feature demonstrated was the concept of Mobile Metrics and how Spotfire can support Mobile BI Reports. In order to get more details on the offerings from Spotfire, please use the following Link:
http://spotfire.tibco.com/
For details on offerings from Cognos, please visit:
http://www-01.ibm.com/software/analytics/cognos/
It would be interesting to see how the BI space pans in the coming year with emphasis on Cloud based offerings and other social network related features being added into the mix of products.
The next feature which was demonstrated was a concept called Location Analytics, this would allow users to build reports based on maps and would provide details with respect to Cities, roads and political boundaries. One of the features highlighted was the concept of Automatic Offline Geocoding, which seems like a neat concept, need to dwelve on these features more to get a understanding of the benefits.
The next feature demonstrated was the concept of Mobile Metrics and how Spotfire can support Mobile BI Reports. In order to get more details on the offerings from Spotfire, please use the following Link:
http://spotfire.tibco.com/
For details on offerings from Cognos, please visit:
http://www-01.ibm.com/software/analytics/cognos/
It would be interesting to see how the BI space pans in the coming year with emphasis on Cloud based offerings and other social network related features being added into the mix of products.
Thursday, January 23, 2014
SSMS Productivity Tips...
SQL Server Management Studio is the widely used tool for developers working on SQL Server development projects. There are numerous times when developers have to scroll through long pieces of code, figure out the logic, identify what variables are being used. While debugging or even while development scrolling through long pieces of code can become tedious. For example let us say I am working on a long stored procedure, i see a block of code way down where I would like to use a table variable or a temp table instead of the logic being used currently. I need to first scroll back way to the top define the temp table or table variable, then come back to the code section where the logic needs to be modified. This process could become tedious or some times we become lazy to keep scrolling up and down. There is a feature in Sql Server Management Studio where in one can split current query window. In SSMS, open the sql/script file , then in the Window Menu , Choose the Split Option. This would split the current query window into 2 Parts.
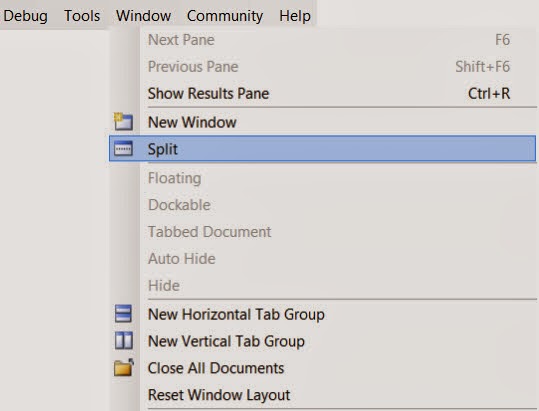 Each window can be scrolled independently. In the example I was showing let us say I was working on the Lines 1200-1220, in the bottom part I could focus on the area of the logic, In the top window I can scroll all the way to the top of the code and declare the variables and temp tables. Please see the image below.
There is also a blog post by SQL Server Expert Kendra Little on this very same topic. Here is the link for the blog post: http://www.brentozar.com/archive/2014/01/ssms-trick-edit-large-procedures-with-the-splitter-bar/.
Hope you folks find this tip useful...
There is also a blog post by SQL Server Expert Kendra Little on this very same topic. Here is the link for the blog post: http://www.brentozar.com/archive/2014/01/ssms-trick-edit-large-procedures-with-the-splitter-bar/.
Hope you folks find this tip useful...
Friday, January 17, 2014
UNPIVOT a Table...
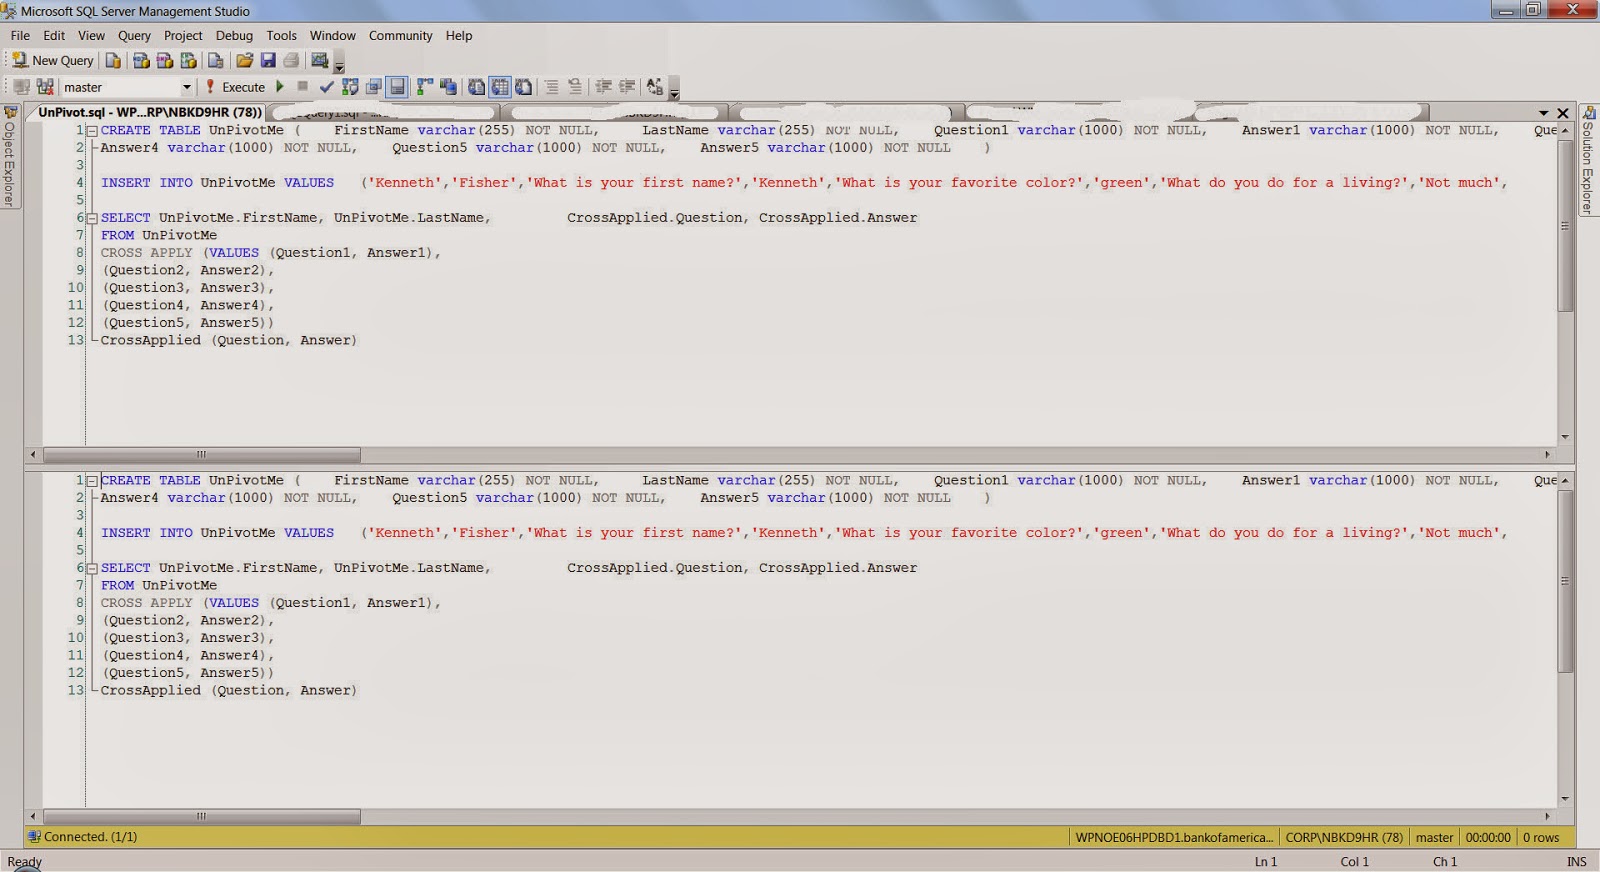
One of the common routines that is done while analyzing or reporting information is Pivoting and Unpivoting of data. There are lot of techniques which are employed to achieve the Pivot/Unpivot Transformation of data. I found one example where the CROSS APPLY VALUES operator is used to achieve the unpivot functionality. The implementation is pretty neat and construct is pretty easy to follow, the standard PIVOT, UNPIVOT operators provided by T-SQL sometimes are hard to follow,
Here is the high level construct: the code below is an example which has been taken from:
http://sqlstudies.com/2013/04/01/unpivot-a-table-using-cross-apply/. Please use the link to get the complete code set.
Here is the high level construct: the code below is an example which has been taken from:
http://sqlstudies.com/2013/04/01/unpivot-a-table-using-cross-apply/. Please use the link to get the complete code set.
SELECT UnPivotMe.FirstName, UnPivotMe.LastName, CrossApplied.Question, CrossApplied.AnswerFROM UnPivotMeCROSS APPLY (VALUES (Question1, Answer1), (Question2, Answer2), (Question3, Answer3), (Question4, Answer4), (Question5, Answer5)) CrossApplied (Question, Answer)One of the observation that can be made is that there is 5 columns for Question and Answer in the UnPivotMe table, which are finally transformed into rows in the final result.FirstName LastName Question Answer
Kenneth Fisher What is your first name? Kenneth
Kenneth Fisher What is your favorite color? green
Kenneth Fisher What do you do for a living? Not much
Kenneth Fisher What is 2x3 6
Kenneth Fisher Why? Because
Bob Smith What is your first name? Robert
Bob Smith What is your favorite color? blue
Bob Smith What is 4x7? 28
Bob Smith What is 7x6 Life the Universe and Everything
Bob Smith Why? Why notMonday, January 6, 2014
ColumnStore Indexes...
With the increasing amounts of data, there is lot of expectations from data warehousing solutions in terms of performance and accuracy. There is a constant demand for increased performance of queries from a data warehouse. With huge amount of rows sometimes performance of queries get affected due to the time spent in pre-aggregating or aggregating data. With this backdrop there has been the emergence of columnstore indexes. What is a columstore index in SQL Server? Quoting from Microsoft Technet: Columnstore indexes in the SQL Server Database Engine can be used to significantly speed-up the processing time of common data warehousing queries. Typical data warehousing workloads involve summarizing large amounts of data. The techniques typically used in data warehousing and decision support systems to improve performance are pre-computed summary tables, indexed views, OLAP cubes, and so on. Based on this definition what is the advantage over traditional row based storage. In Databases with ColumnStore indexes SQL Server stores data in a columnar format based on the column with columnstore Index. Since data is stored one column At a time, this allow sql server to perform aggregations on the single column very quickly instead of traversing through each row. Also Since only the columns needed must be read this greatly reduces the Disk I/O activity. Most queries do not encompass all columns in a table which means that lesser data would be bought into memory thereby enhancing the speed of the queries.
Some important points to keep in mind with respect to ColumnStore index
Clustered index key – If a base table is a clustered index, all columns in the clustering key must be present in the nonclustered columnstore index. If a column in the clustering key is not listed in the create index statement, it will be added to the columnstore index automatically.
Partitioning – Columnstore indexes works with table partitioning. No change to the table partitioning syntax is required. A columnstore index on a partitioned table must be partition-aligned with the base table. Therefore a nonclustered columnstore index can only be created on a partitioned table if the partitioning column is one of the columns in the columnstore index.
In SQL Server 2012 Columnstore indexes are not updatetable, i guess in SQL Server 2014 there are plans to make them updatetable.
Subscribe to:
Posts (Atom)