First, I would like to wish the readers of my blog a very happy and prosperous new year 2016. Due to personal challenges i could not post much in 2015, i hope i can do better in 2016. Looking forward to how the year 2016 shapes up for analytics, if there are newer trends or consolidation of big and small technology firms in the analytics space. There were lot of strides made in data science, the programming language R has become increasingly popular across various industry domains, More business folks are beginning to understand the power of good models and how it can be pursued for predictive analytics. There were also strides made in bringing R and SQL Server together, this will be seen more in 2016 as we begin to see more valid business used cases.
Here is a link for the Top Big 3 data trends in 2016.
http://insidebigdata.com/2015/12/29/the-top-3-big-data-trends-of-2016/
Once again wishing everyone a very happy 2016.
Thursday, December 31, 2015
Monday, November 16, 2015
Using Data Science Techniques with R- Zillow.com
R language has been gaining increasing popularity as Machine Learning, Predictive analytics take more and more importance within business. The applications of R has been steadily increasing in different industry domains. One of the areas where the R language is being very strongly used is in the are of Real Estate to predict selling prices of Homes Please read the link to blog post below related to how the company Zillow uses R for predicting estimates of prices for houses.
http://www.datanami.com/2015/08/12/inside-the-zestimate-data-science-at-zillow/
As the article indicates they use a mix of tools at different stages of the data value chain. The more cleaner the data is, the better the prediction is going to be.
http://www.datanami.com/2015/08/12/inside-the-zestimate-data-science-at-zillow/
As the article indicates they use a mix of tools at different stages of the data value chain. The more cleaner the data is, the better the prediction is going to be.
Saturday, October 17, 2015
Predictive Analytics-R Programming, SSAS Data Mining
Today i had the opportunity to attend the SQL Saturday Session in Charlotte today. It was a very well organized event with lot of topics ranging from SQL Development to Predictive Analytics. The interest in data science, big data and Predictive analytics seems to be growing rapidly. I attended some great sessions, first session i attended was R programming for SQL Developers presented by Kiran Math (Data Analytics Expert) from Greenville, SC. He currently works for a start up firm in Greenville, SC where he is working as a Data Analyst. He covered topics ranging from how to download R and R-Studio, did some comparisons between R and SQL Server in terms of commonalities around how data can be retrieved, filtered and aggregated. There was some coverage on the RODBC driver as well, this is the ODBC driver that can be used in R to connect to SQL Server Databases. In this blog post i would like to cover certain functions and packages in R that can be used for shaping the data and also removing bad values.The power of R language comes from the packages that are available. One of the packages is called dplyr, this can be installed by using the following commands:
install.packages("dplyr")
library("dplyr")
Once the above package is downloaded and installed, the following commands are available:
To Select the data from a dataframe in R:
select - select(df,product,vendor) - selects the columns product,vendor from data frame df.
filter - filter(df,product=="cars") - selects the rows where the product is equal to cars
mutate - mutate(df, saleprice= qty * price) - here the column saleprice is created by calculating using qty and price. These commands are useful for data profiling and creating columns as categorical variables in the data frame. Categorical variables are really useful while doing the modeling process. There are other functions within the dplyr package which can be accessed in this link: https://cran.rstudio.com/web/packages/dplyr/vignettes/introduction.html.
There is an another package called tidyr package which has lot of very useful functions, one such useful function is called gather: gather function takes multiple columns and collapses into key-value pairs, this really helps in shaping up the data.For example: let us say you want to compare sales prices of houses in different zip codes.
One of the other important packages is called ggplot2, it is a very important package that helps one to do advanced visualizations, this package relies on the concept of grammar of graphics where the visualizations are built by adding layers to enhance the plots. Please refer to the documentation here:
http://ggplot2.org/
The session on R was very informative and there was a demo on how to determine the sale price of a house that is 2500 sqaure foot in a particular zip code.
The next session i attended was on PowerBI architecture, implementation and usage. Melissa Coates, a SQL Server BI Professional/Expert provided an excellent overview of the PowerBI architecture and how the product has evovled with different features available in the On-Premise/Desktop and the cloud versions. There were really neat features that were demonstrated and how the reports can be shared within the organization/group of users. There are a lot of options available within the product that can be leveraged very effectively within the organization..
The session on Data Mining in SSAS was very effectively presented by Mark Hudson , Data Analytics/Data Mining expert from Captech. The terminology related to data mining was clearly explained to the audience so that we could take forward the concepts into the actual data mining models. The concepts related to continuous and discrete variables, does cor-related variables really cause causation were effectively discussed. Predictive modeling/Data Mining aim to produce predictions and not guarantee's. Next a baseball data set that pretty sizeable was used to demonstrate the data mining models. Here the data mining model was built directly using a query on a relational table in sql server database. One of the requirements for Data mining models is that there has to be a unique key per table, no composite keys allowed. He used the baseball data in a table as a source for the data mining models. For the demo he touched upon Decision Tree, Clustering and Naive Bayes algorithms. Currently SSAS data mining comes with 9 algorithms and is available in MultiDimensional SSAS only. Once the data is pulled into a data source view, the mining structure is built based on the columns pulled in and the attribute that needs to be predicted is selected along with other input variables. The variables that are not needed for the models can be removed at this stage. Once these were completed 3 mining models were built based on the algorithms (Decision Tree, Clustering and Naive Bayes) and executed. Once the models were built the results can be analyzed in the Mining Model viewer within SSAS and those can be used to validate the data set. The difference between SSAS and R is that while SSAS is more graphical and UI driven, R Language provides more control on how the models can be constructed from ground up and does involve more coding.
Overall the event was a great success in terms of learning, sharing and meeting with other SQL Server Experts.
Sunday, September 27, 2015
SSRS - What is new in SQL Server 2016...
SQL Server 2016 is around the corner, there are lot of improvements/new features that are being deployed as part of SQL Server 2016. One of the areas where there have been improvements made is SSRS, this reporting tool has been overshadowed by Self service BI tools such as Power BI and other reporting tools. I would like to present the blog article from Matt Landis where he discusses about SSRS in SQL Server 2016.
http://windowspbx.blogspot.com/2015/05/sql-server-2016-reporting-services-ssrs.html
Some highlights from SSRS in SQL Server 2016:
http://windowspbx.blogspot.com/2015/05/sql-server-2016-reporting-services-ssrs.html
Some highlights from SSRS in SQL Server 2016:
- Now supports all major browser: Internet Explorer, Chrome, Firefox, and Safari
- Power BI Integration
- Report templates and themes similar to Power BI
- Customize Report Themes using CSS
- Improved report parameter UI
- Now supports mobile BI and data visualization on Windows, iOS, and Android devices
Thursday, August 13, 2015
Azure ML Studio - Part 2
In continuation of my earlier blog post related to Azure ML studio, I would like to describe some additional components that can be used while setting up an experiment. One of the main components available in the Experiment designer is called Statistical functions. This section has a set of multiple functions to choose from, they range from Elementary Statistics to Hypothesis testing. These components would typically used once the dataset has been cleansed to an extent so that one can accurate readings of the data from the experiment. Please see the image below. In this example after executing an R-Script the output is fed to an Descriptive Statistics module.

The Descriptive statistics module typically can include Counts, Range, Statistical Summaries and Percentiles. Once the descriptive statistics is completed, the output can be stored on a variety of formats and this is provided by the writer component. Please see the image below. The Data destination can be
 Azure (SQL Database, blob storage, table), Hive Query. Each format has its own advantages and for more info, one can refer to the link here: https://msdn.microsoft.com/library/azure/7a391181-b6a7-4ad4-b82d-e419c0d6522c
The Descriptive statistics module typically can include Counts, Range, Statistical Summaries and Percentiles. Once the descriptive statistics is completed, the output can be stored on a variety of formats and this is provided by the writer component. Please see the image below. The Data destination can be

Friday, August 7, 2015
Azure ML Studio - Part 1
Data Science has been experiencing tremendous growth in the business world today, there is a tremendous scope/job opportunities for people with Data Science Experience. One of the challenges has been to learn the different components of Data Science since most of them involve lot of Statistical, Math, Data Mining Algorithms knowledge. Microsoft on its part has been working steadily expose data science for the programming public. Initially Azure was slow to take off, but now with growing cloud implementations, Azure has been experiencing a lot of growth. So Microsoft decided to use the Azure platform and provide Data Science tools for the programmers. One of the very effective tools that is offered is called the Azure ML Studio, this is a development environment for Machine Learning Model Development. The interface of this tool is similar to some of the Visual Studio tools provided earlier by Microsoft. In order to start using a the Azure ML Studio one needs to have a Azure account. The whole concept of Azure ML works on the concept of Software as a service. One can use the following link to learn more about the Azure ML capabilities:
https://studio.azureml.net/
Once you login to the azure studio, the first that will happen is that the workspace will be set up. There will be a + symbol at the bottom of the workspace, click on that to create your first experiment. You have a couple of choices here 1) You can create a blank experiment 2) You Can create a experiment based on the templates provided. The option 2 would help one to set up an experiment quickly and understand the various components of the experiment. When you choose from the samples, you can either open it in ML Studio and view it in the gallery. I feel tools like Azure ML studio provide a great first step in exploring the power of Machine Learning/Data Science.
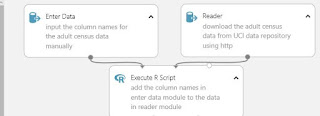
 In the image above the column_name is the header in the csv file and the other below it are actual column names which would be used to assign it to the data set ready by reader component.

One of the components in the above image is the Enter Data component. This component is primarily used for defining column headings, these column headings can be used to assign to the data sets that are read through the Reader component. In this case in the Reader component, we are downloading a file from a website. Since in this example the headers of the file downloaded by Reader component were not user friendly, we use the Enter Data component to provide meaningful column_names. In this example we have used the column_names to be in the csv format. For example please see the image below for Enter Data component:
Monday, August 3, 2015
Tableau and R Integration...
Among the Data visualization tools, tableau is one of the leading tools which is used by lot of organizations in various capacities. The types of reporting range from operational to really sophisticated data visualizations combining various data sources. With R growing to be a language of choice for Data Science related activities such as Machine Learning and Data Mining, it is being integrated with a variety of Tools. Given such a scenario it was natural to expect the integration between tableau and R to happen. Please see the link below for a video on R and tableau integration.
http://www.tableau.com/new-features/r-integration
Quoting tableau" Tableau Server can also be configured to connect to an instance of Rserve through the tabadmin utility, allowing anyone to view a dashboard containing R functionality".
Also the link contains a whitepaper on integration between the two tools, please check out the same.
Lot of interesting things happening in the Data Science these days...
Wednesday, July 29, 2015
SQL Server 2016 and R-Integration...Part 2
In this blog post I would like to continue the discussion which done in the Part 1 of the SQL Server 2016 and R-Integration. In this blog post I would like to discuss one of the important R Libraries that can speed up the learning process a little and get to analyzing the data more quickly. The library I would like to discuss here is called Rattle. The library rattle can be installed in R by using the following commands. The commands below can be executed within R-Studio. The R-Studio is a more UI friendly to work on R-Commands and scripts.
install.packages("rattle")
rattle()
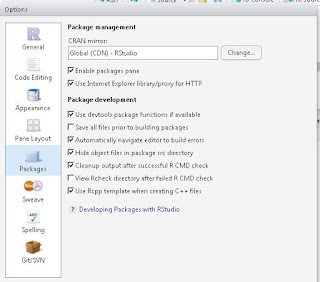
The install.packages() command in R will install all the files within the rattle library. In R-Studio one would set up the path to pull down the libraries as needed. As you can see the option for Use Internet Explorer Library/Proxy for HTTP is enabled.
Once the package is installed, you can execute the rattle() function with the R-Studio, this will launch a GUI for rattle which has lot of useful options for doing data analysis. In the Rattle GUI as you can see there are lot of options that can be used for source of data, in the example below I am choosing the R-Dataset called who for analysis. Make sure to hit the execute option once you have chosen the data source from the drop down list.

In order to explore the dataset , use the explore tab and choose the summary option and I additionally choose Basics. These 2 options combined provides an quick overview of the dataset who by providing some important statistical data about the data set.

There are a lot more options available in rattle to do much more complex data analysis. As the integration between SQL Server and R continues, I am hoping such utilities are provided by Microsoft so that the data analysis can be more enhanced
install.packages("rattle")
rattle()
The install.packages() command in R will install all the files within the rattle library. In R-Studio one would set up the path to pull down the libraries as needed. As you can see the option for Use Internet Explorer Library/Proxy for HTTP is enabled.

Once the package is installed, you can execute the rattle() function with the R-Studio, this will launch a GUI for rattle which has lot of useful options for doing data analysis. In the Rattle GUI as you can see there are lot of options that can be used for source of data, in the example below I am choosing the R-Dataset called who for analysis. Make sure to hit the execute option once you have chosen the data source from the drop down list.

In order to explore the dataset , use the explore tab and choose the summary option and I additionally choose Basics. These 2 options combined provides an quick overview of the dataset who by providing some important statistical data about the data set.

There are a lot more options available in rattle to do much more complex data analysis. As the integration between SQL Server and R continues, I am hoping such utilities are provided by Microsoft so that the data analysis can be more enhanced
Monday, July 27, 2015
Cortana Analytics - Microsoft
In today's world of big data, cloud, mobile paradigm there have been a slew of analytic/dashboard tools out there, trying to get the attention of business and grab market share. One of the tools that I came across and looking forward to getting a deeper dive into the details is the Cortana Analytics suite from Microsoft. Microsoft is coming out with lot of offerings these days that look exciting and interesting. Here is the link that explains why Cortana Analytics from Microsoft.
http://www.microsoft.com/en-us/server-cloud/cortana-analytics-suite/why-cortana-analytics.aspx.
One of the key features that I tam wanting to explore further is the aspect of perceptual intelligence:
Quoting the web site "Interact with customers and stakeholders in new ways and infer intent with vision, face, speech, text and sentiment analysis to customize responses and drive appropriate actions". This would be really interesting to see how things play out here. There are a couple of events I plan to attend to see if there are any used cases related to the topic of perceptual intelligence. Once you go the link above, one can actually see industry specific used cases examples documented on the website. Will post another topic related to Cortana once I get through some presentations.
Thursday, July 23, 2015
Big Data, Column Store, InMemory...
With the increase in data that is being stored and analyzed , the concepts such as Big Data, Column Store and In Memory databases have been in discussion or being used by different organizations. Also there are multiple vendors at play, the one size fits all doesn't seem to be working. Please see this video where in Michael Stonebraker talks about the different concepts such as Column Store, Big Data and In Memory databases. He specifically mentions not to give in to the marketing hype and use proper proof of concepts on site with the data that needs to be analyzed to arrive at the right solution needed for an Organization. Here is the link for the video, it is a bit old but I felt is very relevant in terms of the questions to be asked.
https://www.youtube.com/watch?v=_00H1cgXeWw. Mike specifically talks about how important columnstore is going to be in Data warehouses.
https://www.youtube.com/watch?v=_00H1cgXeWw. Mike specifically talks about how important columnstore is going to be in Data warehouses.
Saturday, July 18, 2015
SQL Server 2016 and R-Integration...Part 1
Earlier I had blogged about SQL Server and R can be connected to perform data analysis. Also in SQL Server 2016 there is supposed to be better R Integration. In today's market Data scientists/Data Wranglers are in great demand since organizations have piles of data and want to make sense of the data, also if data can provide valuable insights. Given these market trends and the push for aligning the business and data more closely it is important to have the analytic skills. In this blog I would like to provide an article which gives a flavor of sql server 2016 and R-Integration. In the link below:
http://blog.revolutionanalytics.com/2015/05/r-in-sql-server.html. The article describes SQL Server program managers Lindsey Allen and Borko Novakovic demonstrated a prototype of running R within SQL Server. For the R-Integration,Microsoft SQL Server has collaborated with http://www.revolutionanalytics.com/products. I hope you find the article and demo provided in the link above useful.
http://blog.revolutionanalytics.com/2015/05/r-in-sql-server.html. The article describes SQL Server program managers Lindsey Allen and Borko Novakovic demonstrated a prototype of running R within SQL Server. For the R-Integration,Microsoft SQL Server has collaborated with http://www.revolutionanalytics.com/products. I hope you find the article and demo provided in the link above useful.
Monday, June 22, 2015
SQL Azure - SQL Server Database to Azure.
Microsoft with the change in leadership at the top, there has been a lot of push for cloud related offerings from Microsoft. One of the components of the cloud suite is SQL Azure which is the cloud based offering of the SQL Server Database system. With the advent of smartphones and increased used of apps in phones, there is a need for having a cloud based database. There are lot of folks using different cloud based offerings for the database, one of my colleagues has launched an app which uses the SQL Azure database. It is possible that folks could use a sql server initially to develop the database and then copy the database over to SQL Azure. Here is a link on how to SSIS to copy a sql server database to SQL Azure.
To quote the article: When migrating a SQL Server database to Microsoft Azure SQL Database, the SQL Server Import and Export Wizard in an easy way to create a SQL Server Integration Services package to transfer data. The package can then be modified to add more robust error handling and retry logic.
https://msdn.microsoft.com/en-us/library/azure/jj156152.aspx
Monday, June 8, 2015
DataZen-Microsoft
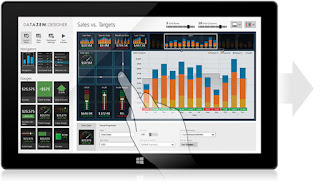
Datazen is a Mobile product that allows BI on Mobile as per the website: Datazen Windows 8 app enables dashboard creation and publishing based on Excel, cloud and enterprise data sources. After publishing to a Datazen Server, dashboards and KPIs are accessible on any device via its native app, or through any major browser. The Mobile app can be downloaded for ios/andrioid and windows phones. For example: I downloaded the Datazen app on my andrioid smartphone. Once the app is downloaded when I launched the app, it connects to a demo server. The App pulls down a set of demo KPI and dashboards. This provides an overview of the type of dashboards that can be built with DataZen. Recently Microsoft has acquired Datazen, this would enable Microsoft to provide a robust BI offering in the mobile space. Datazen server requires Windows Server,IIS and .NET as the prerequisites. Please look at the image for a sample of what is possible with the Datazen tool.
The Datazen link is : http://www.datazen.com/overview/, all the details are available here.
The Datazen link is : http://www.datazen.com/overview/, all the details are available here.
There is a detailed blog on capabilities of Datazen by SQL Server Expert: Melissa Coates at her blog site: http://www.sqlchick.com/entries/2015/6/3/prototyping-layout-and-design-with-datazen. This blog post specifically talks about Prototyping and Design with Datazen.
Monday, May 11, 2015
SQL Server and R Integration...
One of the most popular languages in the Data Science Paradigm is the R language, there are plenty of resources and online classes being offered with respect to the R language. Once of the main advantages with the R language is that it is open source and can be downloaded on multiple platforms such as windows/Mac/Linux, also there is a very popular IDE for R called the R-Studio. SQL Server has been expanding to get into different domains one of them now being is Data Science. in SQL Sever 2016 there are lot more integration promised between R and SQL Server. In the mean time there are ways to integrate between R and SQL Server, here is a blog article on Simple talk by SQL Server Expert Feodor Georgiev, the article is titled: Making Data Analytics Simpler: SQL Server and R.
https://www.simple-talk.com/sql/reporting-services/making-data-analytics-simpler-sql-server-and-r/.
The article also provides a brief overview of the R language.
https://www.simple-talk.com/sql/reporting-services/making-data-analytics-simpler-sql-server-and-r/.
The article also provides a brief overview of the R language.
Tuesday, May 5, 2015
SQL Server 2016 Preview...
I am not sure if I have dug enough into SQL Server 2014 but SQL server 2016 Preview is coming this summer. The pace at which technology has been evolving in DB/BI space has been amazing.
Here are some of the Features mentioned to be available in SQL Server 2016:
1. Always Encrypted:
2. Stretch Database
3. Real Time Operational Analytics & In-Memory OLTP
4. Built-in Advanced Analytics, PolyBase and Mobile BI
Additional capabilities in SQL Server 2016 include:
http://blogs.technet.com/b/dataplatforminsider/archive/2015/05/04/sql-server-2016-public-preview-coming-this-summer.aspx
Here are some of the Features mentioned to be available in SQL Server 2016:
1. Always Encrypted:
2. Stretch Database
3. Real Time Operational Analytics & In-Memory OLTP
4. Built-in Advanced Analytics, PolyBase and Mobile BI
Additional capabilities in SQL Server 2016 include:
- Additional security enhancements for Row-level Security and Dynamic Data Masking to round out our security investments with Always Encrypted.
- Improvements to AlwaysOn for more robust availability and disaster recovery with multiple synchronous replicas and secondary load balancing.
- Native JSON support to offer better performance and support for your many types of your data.
- SQL Server Enterprise Information Management (EIM) tools and Analysis Services get an upgrade in performance, usability and scalability.
- Faster hybrid backups, high availability and disaster recovery scenarios to backup and restore your on-premises databases to Azure and place your SQL Server AlwaysOn secondaries in Azure.
http://blogs.technet.com/b/dataplatforminsider/archive/2015/05/04/sql-server-2016-public-preview-coming-this-summer.aspx
Tuesday, April 28, 2015
Data Discovery...
With a slew of tools and vendors coming in the BI Space, there has been one area of BI where there have lot of tools coming. It is the area of data discovery, there is a lot of interest in the business/technology users to discover/profile/analyze the data available. Prior to starting a project users are wanting to look at data available to make decisions on how to move forward. The tools that exists today like PowerBI from Microsoft provides the user a quick start into looking at the data. One of the vendors providing such data discovery and other related tools in the BI Space is BeyondCore. Here is the link for the website: http://www.beyondcore.com. BeyondCore has interesting capabilities like analyzing data within Microsoft Office, they call it the one click automated analytics within Microsoft office. Some of the features claimed by BeyondCore that is not in other virtualization products are:
1. One Click Data Cleansing
2. One Click Hypothesis Free Analysis.
3. Diagnostic and Predictive Analysis.
4. Collaborative Analysis
5. Animated Briefing.
The whole set of advantages are listed here in this link below:
http://www.beyondcore.com/advantages/
There are lot of discovery tools out there along with BeyondCore. The important thing is can these Data Discovery tools answer the questions that the Business/Organizations have about the data that would be the determining factor.
Thursday, April 23, 2015
Happenings in Microsoft BI...
There have been lot of movements, happenings going on in the Microsoft BI space. There is lot of developments happening in the Power BI/Self Service BI Space. Please see the blog post below from BI Expert Jen Underwood: She has summarized the happenings and she also writes very good articles in the BI/Analytics Space.
http://www.jenunderwood.com/2015/04/23/april-microsoft-bi-world-news/
http://www.jenunderwood.com/2015/04/23/april-microsoft-bi-world-news/
Monday, April 13, 2015
Power View - Analyzing Data...
There have been lot of buzz about Power BI/Power Viewer and its use for Self service BI, also the options to connect to different data sources have been increasing. Here is a link below which discusses use of PowerView tool for analyzing cricket data as part of the world cup series. It is a fun experiment but at the same time provides insight into how PowerView works.
http://blogs.office.com/2015/
http://blogs.office.com/2015/
Thursday, January 29, 2015
Power BI-New Version...
Microsoft is really pushing into the cloud space in a big way, making a lot of investments in the cloud and also related development tools. One of the aspects of cloud that was discussed in the Microsoft earnings report was about the self service BI tools especially related to Power BI. Power BI was a set of tools released by Microsoft to enable users to perform self service BI operations mainly aimed at the power users/systems analyst/financial analyst user base. It was different from the traditional data warehousing/BI tools that Microsoft has. With the recent release of Power BI Microsoft has decided to open up the door in a big way and allows users to play around with Power BI. On going to the web site http://www.powerbi.com, one is asked to enter a work email address and sign up for access. Once you setup an account, one gets to log in to the Power BI public preview page where one can see sample dashboards and charts, also there s a start up video for first time users who would like to go through the capabilities. Please refer to the screen below which shows how it looks when you first log into Power BI Public Review.

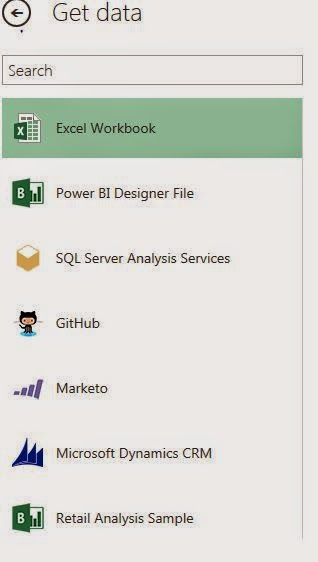
There are capabilities to create Reports, DataSets and DashBoards. When you click on the Get Data Option you are presented with the following options:
 The user gets a variety of option to play around with , it is interesting to see that it has connections to repositories like Github. The main purpose of this release seems to be get this in the hands of as many users as possible so that the features can be explored and analyzed, with that also get some serious interest generated around Power BI. Hope this blog article helps in exploring the Power BI and its features.
There are capabilities to create Reports, DataSets and DashBoards. When you click on the Get Data Option you are presented with the following options:
Monday, January 5, 2015
Happy New Year 2015...
Wishing all the readers of my blog a happy and prosperous New Year 2015. In this year one can see how the big data technologies mature or adopted within organizations. What happens to predictive analytics/machine learning type of technologies, how well they come into mainstream organizations. How is the role of data scientists going to evolve, along side with the traditional data warehouse technologies. There is a very good introduction course on The Data Scientist's toolbox that covers the foundation required for Data analysis and Data Scientists role.www.coursera.org.
Subscribe to:
Posts (Atom)