As we wind down year 2016 and move into 2017, there is lot of anticipation as to what will be the analytics like in 2017. 2016 saw a lot of development in the area of analytics with increasing range of applications in different industries/business. Big data in 2016 made significant inroads in 2016 and hope to see it solidify in 2017 with more number of business adopting such technologies. There was also lot of constructive debate around Big data analytics in 2016. There are more companies introducing machine learning technologies, one of the most prominent being Echo, Alexa from Amazon. There are other companies which are introducing machine learning capabilities in their applications.
Now i am providing a link which takes a lot what are the expected trends in 2017. One of the expected trend in 2017 especially for Developers in the BI/Database arena:
Traditional programmers will be required to gain data science skills in order to stay relevant, employable, and effective in their careers.
http://www.ibmbigdatahub.com/blog/big-data-and-analytics-trends-2017-james-kobielus-s-predictions.
Wishing every one a very happy and prosperous new year 2017. Hope to write more articles in year 2017.
Thank you
Showing posts with label Analytics. Show all posts
Showing posts with label Analytics. Show all posts
Sunday, December 25, 2016


Thursday, August 13, 2015
Azure ML Studio - Part 2
In continuation of my earlier blog post related to Azure ML studio, I would like to describe some additional components that can be used while setting up an experiment. One of the main components available in the Experiment designer is called Statistical functions. This section has a set of multiple functions to choose from, they range from Elementary Statistics to Hypothesis testing. These components would typically used once the dataset has been cleansed to an extent so that one can accurate readings of the data from the experiment. Please see the image below. In this example after executing an R-Script the output is fed to an Descriptive Statistics module.

The Descriptive statistics module typically can include Counts, Range, Statistical Summaries and Percentiles. Once the descriptive statistics is completed, the output can be stored on a variety of formats and this is provided by the writer component. Please see the image below. The Data destination can be
 Azure (SQL Database, blob storage, table), Hive Query. Each format has its own advantages and for more info, one can refer to the link here: https://msdn.microsoft.com/library/azure/7a391181-b6a7-4ad4-b82d-e419c0d6522c
The Descriptive statistics module typically can include Counts, Range, Statistical Summaries and Percentiles. Once the descriptive statistics is completed, the output can be stored on a variety of formats and this is provided by the writer component. Please see the image below. The Data destination can be

Friday, August 7, 2015
Azure ML Studio - Part 1
Data Science has been experiencing tremendous growth in the business world today, there is a tremendous scope/job opportunities for people with Data Science Experience. One of the challenges has been to learn the different components of Data Science since most of them involve lot of Statistical, Math, Data Mining Algorithms knowledge. Microsoft on its part has been working steadily expose data science for the programming public. Initially Azure was slow to take off, but now with growing cloud implementations, Azure has been experiencing a lot of growth. So Microsoft decided to use the Azure platform and provide Data Science tools for the programmers. One of the very effective tools that is offered is called the Azure ML Studio, this is a development environment for Machine Learning Model Development. The interface of this tool is similar to some of the Visual Studio tools provided earlier by Microsoft. In order to start using a the Azure ML Studio one needs to have a Azure account. The whole concept of Azure ML works on the concept of Software as a service. One can use the following link to learn more about the Azure ML capabilities:
https://studio.azureml.net/
Once you login to the azure studio, the first that will happen is that the workspace will be set up. There will be a + symbol at the bottom of the workspace, click on that to create your first experiment. You have a couple of choices here 1) You can create a blank experiment 2) You Can create a experiment based on the templates provided. The option 2 would help one to set up an experiment quickly and understand the various components of the experiment. When you choose from the samples, you can either open it in ML Studio and view it in the gallery. I feel tools like Azure ML studio provide a great first step in exploring the power of Machine Learning/Data Science.
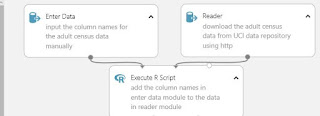
 In the image above the column_name is the header in the csv file and the other below it are actual column names which would be used to assign it to the data set ready by reader component.

One of the components in the above image is the Enter Data component. This component is primarily used for defining column headings, these column headings can be used to assign to the data sets that are read through the Reader component. In this case in the Reader component, we are downloading a file from a website. Since in this example the headers of the file downloaded by Reader component were not user friendly, we use the Enter Data component to provide meaningful column_names. In this example we have used the column_names to be in the csv format. For example please see the image below for Enter Data component:
Monday, July 27, 2015
Cortana Analytics - Microsoft
In today's world of big data, cloud, mobile paradigm there have been a slew of analytic/dashboard tools out there, trying to get the attention of business and grab market share. One of the tools that I came across and looking forward to getting a deeper dive into the details is the Cortana Analytics suite from Microsoft. Microsoft is coming out with lot of offerings these days that look exciting and interesting. Here is the link that explains why Cortana Analytics from Microsoft.
http://www.microsoft.com/en-us/server-cloud/cortana-analytics-suite/why-cortana-analytics.aspx.
One of the key features that I tam wanting to explore further is the aspect of perceptual intelligence:
Quoting the web site "Interact with customers and stakeholders in new ways and infer intent with vision, face, speech, text and sentiment analysis to customize responses and drive appropriate actions". This would be really interesting to see how things play out here. There are a couple of events I plan to attend to see if there are any used cases related to the topic of perceptual intelligence. Once you go the link above, one can actually see industry specific used cases examples documented on the website. Will post another topic related to Cortana once I get through some presentations.
http://www.microsoft.com/en-us/server-cloud/cortana-analytics-suite/why-cortana-analytics.aspx.
One of the key features that I tam wanting to explore further is the aspect of perceptual intelligence:
Quoting the web site "Interact with customers and stakeholders in new ways and infer intent with vision, face, speech, text and sentiment analysis to customize responses and drive appropriate actions". This would be really interesting to see how things play out here. There are a couple of events I plan to attend to see if there are any used cases related to the topic of perceptual intelligence. Once you go the link above, one can actually see industry specific used cases examples documented on the website. Will post another topic related to Cortana once I get through some presentations.
Tuesday, May 13, 2014
Data Analytics-SQL Server...
One of the more popular term that is doing rounds these days is the term called Data Scientists. This seems to have emerged alongside the growth of Big Data. As part of the Data scientists role it is expected to have a good knowledge of statistical tools and data modelling concepts using mathematics plus exposure tools like SAS,SPSS and R. One of the tools i came across recently which is being used in the Big Data world is R. Today I had the opportunity to attend a session organized by PASS on SQL Server and R, this was presented by Tomaz Kastrun. The session focused on how R can be used with SQL Server to perform Data Analysis. As per Tomaz:
"The Language R is a powerful language for data analysis with all the great features for data import from SQL Server Environment". The Language R along with SQL Server data would be a powerful tool for data scientists to use wide range of statistics. There are statistical functions in SQL Server as part of T-SQL but they tend to be more of the standard/simplistic statistical functions. In case we have to use more complex statistical functions then the T-SQL Code would get longer and more complex which would lead to maintainability issues. This is where tools like R Language come in which can be used with SQL Server to produce very effective results. Here is a definition/purpose of R-Language (which was presented as par of the topic).
 In order for the SQL Server Integration with R, one would need the following:
SQL Server
R-Language (needs to be installed) - This is available at the site: http://www.rstudio.com
Data (of Course), it would be good to cleanse the data before using for analysis with R.
The topic presented shows different opportunities that exists to leverage current tools like SQL Server and combine them with a powerful statistical language like R. This provides different analytical capabilities for the Data Scientists/Developers.
"The Language R is a powerful language for data analysis with all the great features for data import from SQL Server Environment". The Language R along with SQL Server data would be a powerful tool for data scientists to use wide range of statistics. There are statistical functions in SQL Server as part of T-SQL but they tend to be more of the standard/simplistic statistical functions. In case we have to use more complex statistical functions then the T-SQL Code would get longer and more complex which would lead to maintainability issues. This is where tools like R Language come in which can be used with SQL Server to produce very effective results. Here is a definition/purpose of R-Language (which was presented as par of the topic).
SQL Server
R-Language (needs to be installed) - This is available at the site: http://www.rstudio.com
Data (of Course), it would be good to cleanse the data before using for analysis with R.
The topic presented shows different opportunities that exists to leverage current tools like SQL Server and combine them with a powerful statistical language like R. This provides different analytical capabilities for the Data Scientists/Developers.
Friday, March 28, 2014
Gartner 2014 Report - BI and Analytics Platforms...
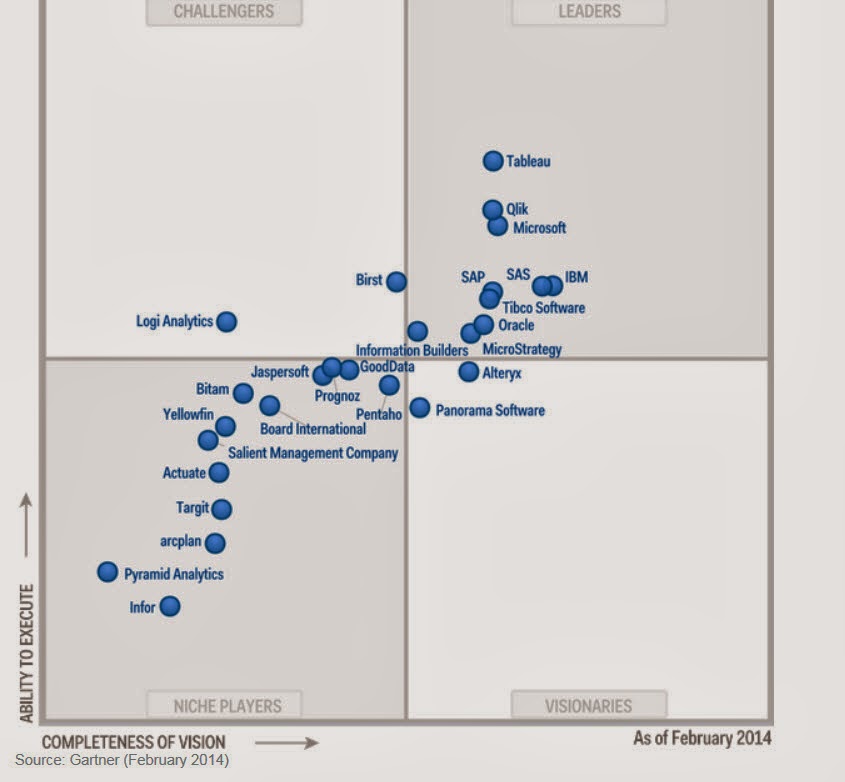
The Gartner report for 2014 related to the Business Intelligence and analytics platform is out, as expected the number of vendors competing in the BI and Analytics space continues to grow. There are niche vendors continuing to enter the market space, at the same there are some vendors who have made it to the leaders quadrant. The vendors were evaluated across 17 categories which were divided into 3 main areas:
Tableau,Qilk,Microsoft,SAP,SAS,IBM,Oracle,Tibco Software,MicroStrategy and Information Builders. Since i use Microsoft suite of products the most, areas of concerns that has been listed are, Interactive visualizations, metadata management and Mobile BI support. As per the report Microsoft is trying to handle the Mobile BI space by using Power BI. Currently Microsoft BI products seemed to be most used in the Enterprise and Small business world the most. One of the challenges that Microsoft faces I feel is cross product integration, we have the traditional Microsoft BI stack on one hand, the Office/Power BI suite on the other, to add to the mix we also have Sharepoint driven BI capabilities. How do these different versions of BI products from Microsoft Co-Exist? At the same time Microsoft is depending on cloud based BI offerings to reduce complexity for smaller companies.
There were other vendors who have good mention with respect to the leader's quadrant: They are:
Tableau
TIBCO Software
Qilk
The concerns for the above three vendors were mainly in the areas of Customer Support and sales. For Qilk as per the report there were mixed opinions about whether product is enterprise ready or not.
In the report there was mention of two cloud based BI vendors:
Birst
Birst's BI platform is primarily a cloud-based offering. It includes a broad range of components, such as data integration, federation and modeling, a data warehouse with a semantic layer, reporting, dashboards, mobile BI and a recently announced interactive visualization tool.
GoodData
GoodData is a cloud BI and analytics specialist. It provides a range of front-end BI capabilities and packaged analytic applications that complement its comprehensive cloud and on-premises source data integration and cloud-based data warehouse platform.
- Information Delivery
- Analysis
- Integration
Tableau,Qilk,Microsoft,SAP,SAS,IBM,Oracle,Tibco Software,MicroStrategy and Information Builders. Since i use Microsoft suite of products the most, areas of concerns that has been listed are, Interactive visualizations, metadata management and Mobile BI support. As per the report Microsoft is trying to handle the Mobile BI space by using Power BI. Currently Microsoft BI products seemed to be most used in the Enterprise and Small business world the most. One of the challenges that Microsoft faces I feel is cross product integration, we have the traditional Microsoft BI stack on one hand, the Office/Power BI suite on the other, to add to the mix we also have Sharepoint driven BI capabilities. How do these different versions of BI products from Microsoft Co-Exist? At the same time Microsoft is depending on cloud based BI offerings to reduce complexity for smaller companies.
There were other vendors who have good mention with respect to the leader's quadrant: They are:
Tableau
TIBCO Software
Qilk
The concerns for the above three vendors were mainly in the areas of Customer Support and sales. For Qilk as per the report there were mixed opinions about whether product is enterprise ready or not.
In the report there was mention of two cloud based BI vendors:
Birst
Birst's BI platform is primarily a cloud-based offering. It includes a broad range of components, such as data integration, federation and modeling, a data warehouse with a semantic layer, reporting, dashboards, mobile BI and a recently announced interactive visualization tool.
GoodData
GoodData is a cloud BI and analytics specialist. It provides a range of front-end BI capabilities and packaged analytic applications that complement its comprehensive cloud and on-premises source data integration and cloud-based data warehouse platform.
Thursday, October 3, 2013
Gartner Report - BI Tools
It is always interesting to read the different reports which cover the BI space which is growing at a enormous space with vendors coming with different capabilities and covering different aspects plus the Cloud Based Offerings. Here is a link to the Gartner report which discusses the BI quadrant for 2013. Some quotes from this report:
Microsoft leads in ability to execute
As I did with the DW report, I'll start with the "winners" in this MQ. Each axis ("ability to execute" and "completeness of vision") had its own winner, and that for the former is Microsoft. I tend to go out of my way to point out my bias on Microsoft. I've long thought the MS BI stack provided significant value, and have watched that value increase recently with the introduction of PowerPivot and SQL Server Analysis Services Tabular mode (in-memory column store databases that are highly integrated with Excel and SharePoint) and Power View (interactive visualization technology integrated with those same products). Microsoft has also recently added Master Data Management and Data Quality tools that, while still maturing, round out very nicely a stack that costs little to nothing for customers already using SQL Server, Office and SharePoint.
Please read the full report below:
http://www.zdnet.com/gartner-releases-2013-bi-magic-quadrant-7000011264/
Microsoft leads in ability to execute
As I did with the DW report, I'll start with the "winners" in this MQ. Each axis ("ability to execute" and "completeness of vision") had its own winner, and that for the former is Microsoft. I tend to go out of my way to point out my bias on Microsoft. I've long thought the MS BI stack provided significant value, and have watched that value increase recently with the introduction of PowerPivot and SQL Server Analysis Services Tabular mode (in-memory column store databases that are highly integrated with Excel and SharePoint) and Power View (interactive visualization technology integrated with those same products). Microsoft has also recently added Master Data Management and Data Quality tools that, while still maturing, round out very nicely a stack that costs little to nothing for customers already using SQL Server, Office and SharePoint.
Please read the full report below:
http://www.zdnet.com/gartner-releases-2013-bi-magic-quadrant-7000011264/
Monday, May 6, 2013
Analytics Reporting and Dashboards...Part 2
In continuation with my earlier blog post, I had the opportunity to get references to some more Analytics reporting and dashboard products. The good news is there is a wide range of tools, also all of them have offerings for the growing Mobile and tablet market. There is a increasing need for delivering BI Solutions on mobile platforms. The 2 Products I have checked out so far has been Strategy Companion (this works on Windows 7 Professional and Enterprise OS, the software does not install on Windows 7 Premium) and bioXL from Pyramid Analytics (has similar set of requirements from Strategy companion). The web site for strategy companion is www.strategycompanion.com. They have products which work for mobile platform as well, they have very good demo videos on the web site and a very helpful support staff. Once you register for a product download they also offer setup support videos which are very useful. They have 3 products Analyzer enterprise, Analyzer Saas and Analyzer mobile. The web site for Analyzer Mobile is http://strategycompanion.com/analyzer-mobile/ and to quote from the web site: Using a “Build Once – Deploy Everywhere” approach, Analyzer Mobile™ enables you to easily provide mobile BI supporting iPads, iPhones, Android smartphones and tablets, BlackBerry smartphones and tablets and Windows Phone 7. No software of any kind needs to be downloaded to anyone’s desktop or mobile device in order to build or deploy your mobile BI reports and dashboards. I found the demos very impressive and would definitely check out more of this product. There other vendors who have product offering in the same space:
They are CALUMO (http://www.calumo.com), their product offerings range from Reporting/Analysis to Dashboards and KPI's. The line up of products are CALUMO for SSAS, CALUMO Skylights and CALUMO Sparks. The company also offers products for Mobile BI Capabilities.
The next vendor I would like to mention is TARGIT, http://www.targit.com/en, they have products offering wide range of capabilities, http://www.targit.com/en/Experience-TARGIT/Products/TARGIT-BI-Analytics/Features-Overview, they state that they do social analytics as well, these days there a lot of effort being directed towards getting valuable information from Unstrucutred data. The product which supports SQL Server can be downloaded from http://www.targit.com/en/Experience-TARGIT/Try-TARGIT/With-NAV-cubes.
I am have been spending my time trying to get through these products in terms of features, each one of them look impressive in terms of capabilities. In case anyone of you know more about these products please do drop a comment and share your experiences.
They are CALUMO (http://www.calumo.com), their product offerings range from Reporting/Analysis to Dashboards and KPI's. The line up of products are CALUMO for SSAS, CALUMO Skylights and CALUMO Sparks. The company also offers products for Mobile BI Capabilities.
The next vendor I would like to mention is TARGIT, http://www.targit.com/en, they have products offering wide range of capabilities, http://www.targit.com/en/Experience-TARGIT/Products/TARGIT-BI-Analytics/Features-Overview, they state that they do social analytics as well, these days there a lot of effort being directed towards getting valuable information from Unstrucutred data. The product which supports SQL Server can be downloaded from http://www.targit.com/en/Experience-TARGIT/Try-TARGIT/With-NAV-cubes.
I am have been spending my time trying to get through these products in terms of features, each one of them look impressive in terms of capabilities. In case anyone of you know more about these products please do drop a comment and share your experiences.
Subscribe to:
Posts (Atom)