Given the nature of today's ETL operations there are lot of complex SSIS packages being built to handle different aspects of Data Processing. One of the key concepts involved with multiple SSIS packages is the passing of parameters between the packages. My friend Pinal Dave, a SQL Server Expert had bought out a excellent post in his famous SQL Server blog. Here is the link to the article.
http://blog.sqlauthority.com/2014/08/07/sql-server-ssis-parameters-in-parent-child-etl-architectures-notes-from-the-field-040/?utm_source=feedburner&utm_medium=feed&utm_campaign=Feed%3A+SQLAuthority+%28Journey+to+SQL+Authority+with+Pinal+Dave%29.
Enjoy reading the article very informative...
Showing posts with label SQL Server 2008. Show all posts
Showing posts with label SQL Server 2008. Show all posts
Thursday, August 7, 2014
Monday, June 30, 2014
Renaming SYSSSISLOG table...
In SSIS we have different ways of logging the progress of the SSIS package, these can be tracked in files or can be done with a table. One of the popular ways of auditing the SSIS package is using a SQL Server table. The table that is used is dbo.sysssislog table, this table is created by default when choosing the Logging of SSIS package to be done via SQL Server. There was a comment/question by one of the readers of my blog, as to whether the table can be renamed into something more meaningful. The answer is yes, here are the steps listed: The one thing to watch out for is to modify the sp_ssis_addlogentry stored procedure to point to the new renamed audit table.
1. Click the table dbo.sysssislog in the database that has the table.
2. Right click on the table and rename the table to what the new name should be.
3. In the SQL Server Management studio expand programmability and choose Stored procedures.
4. Right click on the sp_ssis_addlogentry stroed procedure and choose modify.
5. Replace the table dbo.sysssislog in the stored procedure with the new renamed table.
6. Press F5 to recompile the stored procedure.
7. This audit table is present in the SQL Server 2008 and SQL Server 2012 database systems.
8. In SQL Server 2005 databases, the table is called sysdtslog90.
9. The stored procedure is called sp_dts_addlogentry, it would be in the stored procedures folder in SSMS.
Monday, April 7, 2014
AS-IS - TO BE...Business Process Management
When I work/worked on BI projects, one of main reason for initiating a project is to make a process better for the business and provide increased value to business in terms of revenue/profits. A good analysis and design of the business requirements would yield very good results. One of the methodologies i have been exposed to as part of Business Process Management is the AS IS TO BE analysis method. As part of this method the first step that is to be done is to understand the current process which is called as the AS IS State. Here one builds a flow diagram of the present system/process in place. Once this completed, the analysis of the current process takes place. In this step any possible flaws/deficiencies are identified, also any possible opportunities to optimise the process is also discussed/documented. The goal here is to identify steps that improve the overall process and provide Business value. Once this step is completed, then we move on to the TO BE stage where the proposed/improved process is documented. In this step the improvements/optimisations are captured. A walk through of the proposed process is performed and made sure that the design can be implemented. There are different tools to perform the AS IS-TO BE methodology. One of the tools available is from visual paradigms, here is the link http://www.visual-paradigm.com/. The specific product that helps with the AS-IS - TO-BE Process is Logizian: Here is the description of the tool from the web site at a high level. One of the reasons to write a blog post on this topic was to highlight the importance of analysis and design in a project where BI solutions are going to be implemented.
http://www.visual-paradigm.com/product/lz/
http://www.visual-paradigm.com/product/lz/
Logizian - BPMN 2.0 Business Workflow Design Software
Easy-to-use and cross-platforms business process design tool that supports business process modeling with Business Process Modeling Notation (BPMN) 2.0, Data Flow Diagram (DFD), decision table and organization chart. Logizian supports also advanced business modeling features like to document working procedures for workflow elements, animating business process diagram, process simulation, reports generation and publishing workflow design to website.
Friday, March 28, 2014
Gartner 2014 Report - BI and Analytics Platforms...
The Gartner report for 2014 related to the Business Intelligence and analytics platform is out, as expected the number of vendors competing in the BI and Analytics space continues to grow. There are niche vendors continuing to enter the market space, at the same there are some vendors who have made it to the leaders quadrant. The vendors were evaluated across 17 categories which were divided into 3 main areas:
Tableau,Qilk,Microsoft,SAP,SAS,IBM,Oracle,Tibco Software,MicroStrategy and Information Builders. Since i use Microsoft suite of products the most, areas of concerns that has been listed are, Interactive visualizations, metadata management and Mobile BI support. As per the report Microsoft is trying to handle the Mobile BI space by using Power BI. Currently Microsoft BI products seemed to be most used in the Enterprise and Small business world the most. One of the challenges that Microsoft faces I feel is cross product integration, we have the traditional Microsoft BI stack on one hand, the Office/Power BI suite on the other, to add to the mix we also have Sharepoint driven BI capabilities. How do these different versions of BI products from Microsoft Co-Exist? At the same time Microsoft is depending on cloud based BI offerings to reduce complexity for smaller companies.
There were other vendors who have good mention with respect to the leader's quadrant: They are:
Tableau
TIBCO Software
Qilk
The concerns for the above three vendors were mainly in the areas of Customer Support and sales. For Qilk as per the report there were mixed opinions about whether product is enterprise ready or not.
In the report there was mention of two cloud based BI vendors:
Birst
Birst's BI platform is primarily a cloud-based offering. It includes a broad range of components, such as data integration, federation and modeling, a data warehouse with a semantic layer, reporting, dashboards, mobile BI and a recently announced interactive visualization tool.
GoodData
GoodData is a cloud BI and analytics specialist. It provides a range of front-end BI capabilities and packaged analytic applications that complement its comprehensive cloud and on-premises source data integration and cloud-based data warehouse platform.

- Information Delivery
- Analysis
- Integration
Tableau,Qilk,Microsoft,SAP,SAS,IBM,Oracle,Tibco Software,MicroStrategy and Information Builders. Since i use Microsoft suite of products the most, areas of concerns that has been listed are, Interactive visualizations, metadata management and Mobile BI support. As per the report Microsoft is trying to handle the Mobile BI space by using Power BI. Currently Microsoft BI products seemed to be most used in the Enterprise and Small business world the most. One of the challenges that Microsoft faces I feel is cross product integration, we have the traditional Microsoft BI stack on one hand, the Office/Power BI suite on the other, to add to the mix we also have Sharepoint driven BI capabilities. How do these different versions of BI products from Microsoft Co-Exist? At the same time Microsoft is depending on cloud based BI offerings to reduce complexity for smaller companies.
There were other vendors who have good mention with respect to the leader's quadrant: They are:
Tableau
TIBCO Software
Qilk
The concerns for the above three vendors were mainly in the areas of Customer Support and sales. For Qilk as per the report there were mixed opinions about whether product is enterprise ready or not.
In the report there was mention of two cloud based BI vendors:
Birst
Birst's BI platform is primarily a cloud-based offering. It includes a broad range of components, such as data integration, federation and modeling, a data warehouse with a semantic layer, reporting, dashboards, mobile BI and a recently announced interactive visualization tool.
GoodData
GoodData is a cloud BI and analytics specialist. It provides a range of front-end BI capabilities and packaged analytic applications that complement its comprehensive cloud and on-premises source data integration and cloud-based data warehouse platform.
Tuesday, March 25, 2014
SQL Scripts...
As a Developer, I have always loved writing scripts to automate tasks in SQL Server. They come in really Handy especially for DBA's and Developers alike. When I used to work as a DBA for a product development firm i had to create scripts as part of installation and provide utility scripts for clients. With the constant evolvement of SQL Server there are lot of areas where scripts can come in handy. Here is a blog by DBA On the Go, where in the some of the useful and quality scripts have been compiled:
http://www.dbaonthego.com/2014/03/my-favorite-free-scripts.html. I am a big fan of Ola hallengren's scripts, please check out the blog link above.
http://www.dbaonthego.com/2014/03/my-favorite-free-scripts.html. I am a big fan of Ola hallengren's scripts, please check out the blog link above.
Monday, February 10, 2014
Power BI - Continued...
Today Microsoft announced the availability of Power BI for Office 365. Power BI recently has been gaining a lot of traction, I attended a session with SQL PASS on 24 hours of BI where in one of the lectures was on Power BI and its components. Please use the following link for More details.
http://www.microsoft.com/en-us/powerbi/default.aspx#fbid=4fJwgwe08Zn
As per Microsoft: a cloud-based business intelligence service that gives people a powerful new way to work with data in the tools they use every day, Excel and Office 365. With Excel you can now discover, analyze, and visualize data like never before to find valuable business insights. With Power BI for Office 365 you can easily deploy a cloud-based BI environment. Couple of features that I would like to mention here:
Quickly create collaborative BI sites – enable anyone to quickly create a collaborative BI site to share workbooks containing data and insights.
Keep reports up to date with scheduled data refresh.
Please visit the the link mentioned above to know more about Power BI and it s capabilities.
In order to understand the differences between Power BI and tableau: Please read the article below written by BI Expert Jen Underwood, very detailed analysis...
http://www.jenunderwood.com/2014/01/02/understanding-the-differences-microsoft-power-bi-and-tableau/
http://www.microsoft.com/en-us/powerbi/default.aspx#fbid=4fJwgwe08Zn
As per Microsoft: a cloud-based business intelligence service that gives people a powerful new way to work with data in the tools they use every day, Excel and Office 365. With Excel you can now discover, analyze, and visualize data like never before to find valuable business insights. With Power BI for Office 365 you can easily deploy a cloud-based BI environment. Couple of features that I would like to mention here:
In order to understand the differences between Power BI and tableau: Please read the article below written by BI Expert Jen Underwood, very detailed analysis...
http://www.jenunderwood.com/2014/01/02/understanding-the-differences-microsoft-power-bi-and-tableau/
Friday, January 31, 2014
BI - Spotfire,Cognos...
There has been continuous growth of vendors offering BI solutions which cover varying aspects of business intelligence. There has been a lot of emphasis on visualization, offering BI on mobile devices and making reports more interactive. One of the recent products which i got to look at were Spotfire and Cognos. Spotfire is a BI tool offering from TIBCO, Cognos is from IBM. SQL Server BI stack has been facing challenges from different vendors, Microsoft also has been growing its offerings. Coming to the 2 products Spotfire and Cognos, one of the common pitches I heard from these 2 vendors is that both of them offer zero footprint solutions, both of them are web driven tools and the user gets to access different modules available in the products. How they have pitching against the SSRS solution from Microsoft is that, with SSRS one needs to a have a client install of Visual Studio or BIDS in order to perform report development. Cognos for example has the following components with in their product like Analysis Studio (which geared more towards cube building), Query Studio and Report Studio. With respect to Spotfire i was able to get information only on Reporting and Visualization. The capabilities from Spotfire with respect to Dashboard looked impressive. Spotfire focused on how users can take advantage of Advanced analytics without requiring client side installs and providing more power to Business users.
The next feature which was demonstrated was a concept called Location Analytics, this would allow users to build reports based on maps and would provide details with respect to Cities, roads and political boundaries. One of the features highlighted was the concept of Automatic Offline Geocoding, which seems like a neat concept, need to dwelve on these features more to get a understanding of the benefits.

The next feature demonstrated was the concept of Mobile Metrics and how Spotfire can support Mobile BI Reports. In order to get more details on the offerings from Spotfire, please use the following Link:
http://spotfire.tibco.com/
For details on offerings from Cognos, please visit:
http://www-01.ibm.com/software/analytics/cognos/
It would be interesting to see how the BI space pans in the coming year with emphasis on Cloud based offerings and other social network related features being added into the mix of products.
The next feature which was demonstrated was a concept called Location Analytics, this would allow users to build reports based on maps and would provide details with respect to Cities, roads and political boundaries. One of the features highlighted was the concept of Automatic Offline Geocoding, which seems like a neat concept, need to dwelve on these features more to get a understanding of the benefits.
The next feature demonstrated was the concept of Mobile Metrics and how Spotfire can support Mobile BI Reports. In order to get more details on the offerings from Spotfire, please use the following Link:
http://spotfire.tibco.com/
For details on offerings from Cognos, please visit:
http://www-01.ibm.com/software/analytics/cognos/
It would be interesting to see how the BI space pans in the coming year with emphasis on Cloud based offerings and other social network related features being added into the mix of products.
Thursday, January 23, 2014
SSMS Productivity Tips...
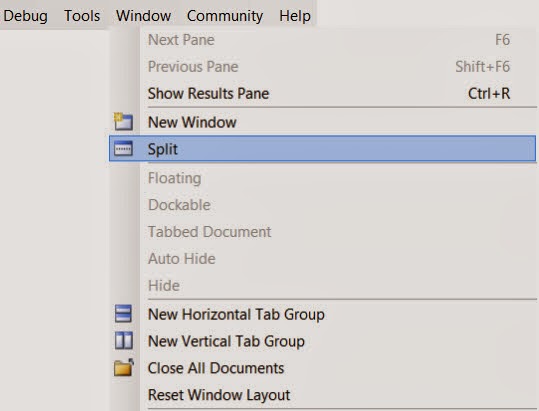
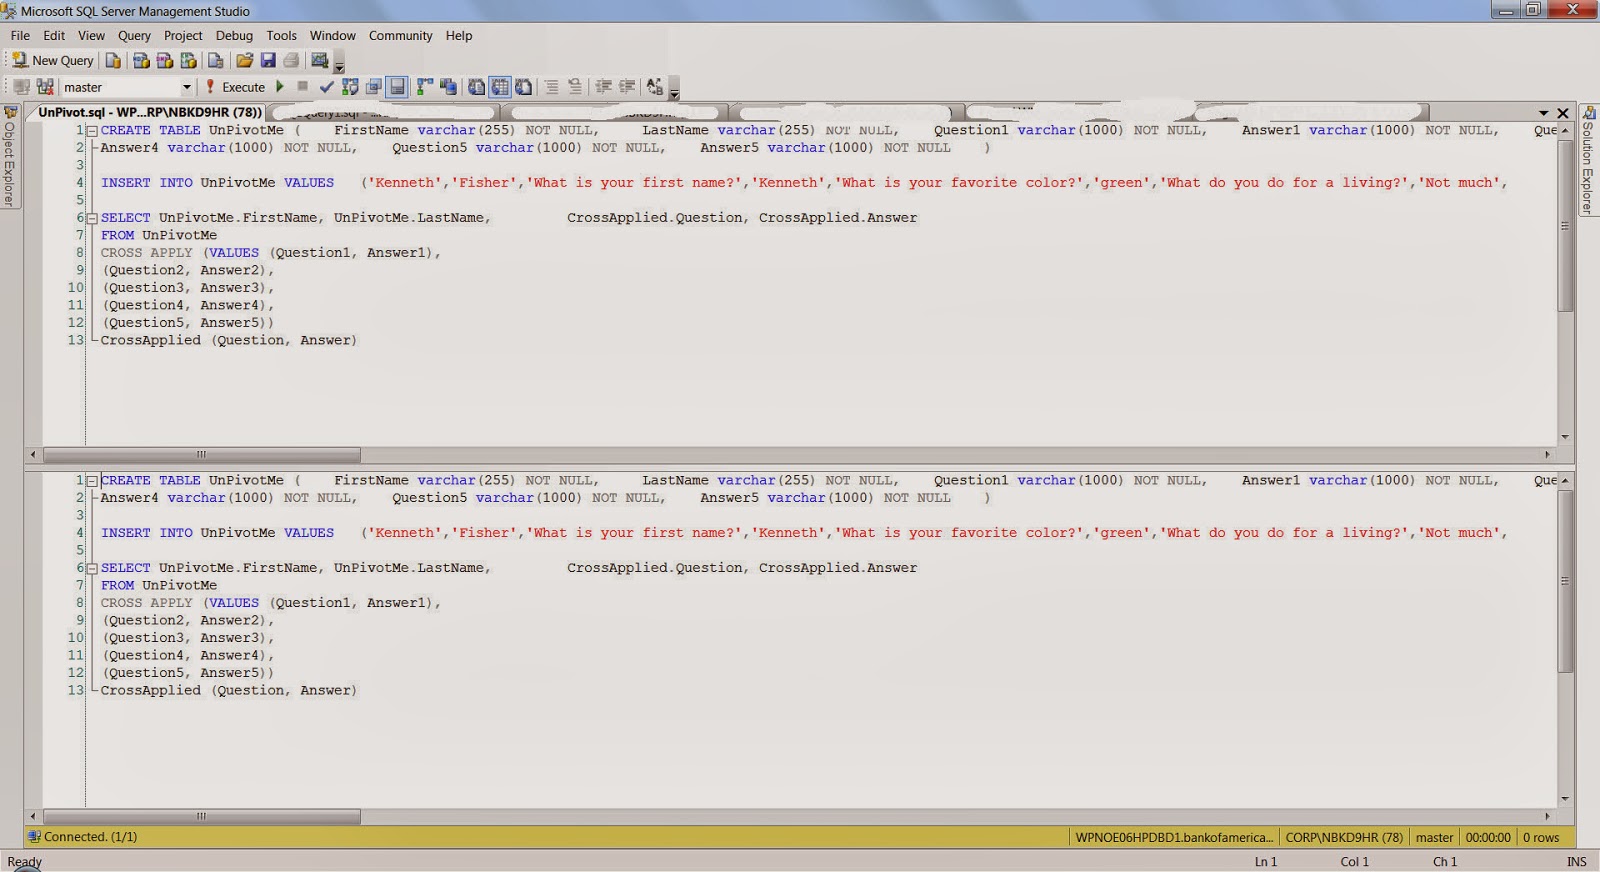
SQL Server Management Studio is the widely used tool for developers working on SQL Server development projects. There are numerous times when developers have to scroll through long pieces of code, figure out the logic, identify what variables are being used. While debugging or even while development scrolling through long pieces of code can become tedious. For example let us say I am working on a long stored procedure, i see a block of code way down where I would like to use a table variable or a temp table instead of the logic being used currently. I need to first scroll back way to the top define the temp table or table variable, then come back to the code section where the logic needs to be modified. This process could become tedious or some times we become lazy to keep scrolling up and down. There is a feature in Sql Server Management Studio where in one can split current query window. In SSMS, open the sql/script file , then in the Window Menu , Choose the Split Option. This would split the current query window into 2 Parts.
 Each window can be scrolled independently. In the example I was showing let us say I was working on the Lines 1200-1220, in the bottom part I could focus on the area of the logic, In the top window I can scroll all the way to the top of the code and declare the variables and temp tables. Please see the image below.
There is also a blog post by SQL Server Expert Kendra Little on this very same topic. Here is the link for the blog post: http://www.brentozar.com/archive/2014/01/ssms-trick-edit-large-procedures-with-the-splitter-bar/.
Hope you folks find this tip useful...
There is also a blog post by SQL Server Expert Kendra Little on this very same topic. Here is the link for the blog post: http://www.brentozar.com/archive/2014/01/ssms-trick-edit-large-procedures-with-the-splitter-bar/.
Hope you folks find this tip useful...
Friday, January 17, 2014
UNPIVOT a Table...
One of the common routines that is done while analyzing or reporting information is Pivoting and Unpivoting of data. There are lot of techniques which are employed to achieve the Pivot/Unpivot Transformation of data. I found one example where the CROSS APPLY VALUES operator is used to achieve the unpivot functionality. The implementation is pretty neat and construct is pretty easy to follow, the standard PIVOT, UNPIVOT operators provided by T-SQL sometimes are hard to follow,
Here is the high level construct: the code below is an example which has been taken from:
http://sqlstudies.com/2013/04/01/unpivot-a-table-using-cross-apply/. Please use the link to get the complete code set.
Here is the high level construct: the code below is an example which has been taken from:
http://sqlstudies.com/2013/04/01/unpivot-a-table-using-cross-apply/. Please use the link to get the complete code set.
SELECT UnPivotMe.FirstName, UnPivotMe.LastName, CrossApplied.Question, CrossApplied.AnswerFROM UnPivotMeCROSS APPLY (VALUES (Question1, Answer1), (Question2, Answer2), (Question3, Answer3), (Question4, Answer4), (Question5, Answer5)) CrossApplied (Question, Answer)One of the observation that can be made is that there is 5 columns for Question and Answer in the UnPivotMe table, which are finally transformed into rows in the final result.FirstName LastName Question Answer
Kenneth Fisher What is your first name? Kenneth
Kenneth Fisher What is your favorite color? green
Kenneth Fisher What do you do for a living? Not much
Kenneth Fisher What is 2x3 6
Kenneth Fisher Why? Because
Bob Smith What is your first name? Robert
Bob Smith What is your favorite color? blue
Bob Smith What is 4x7? 28
Bob Smith What is 7x6 Life the Universe and Everything
Bob Smith Why? Why notFriday, November 29, 2013
SQL Server Management Studio - Project
One of the features I like in sql server management studio is when the Solution Explorer got added. This is very similar to the one in Visual Studio, one of the nice things about this is the ability to keep things organised. When working with sql server Management studio and one is on a large project/being dba is to use multiple query files. Even though one maintains the files in folders, using the solution explorer can keep things organised. The solution explorer allows one to maintain the important server connections and queries all in one place. One of the options I noticed recently in SSMS is what you see in the image below: When you click on the File Menu option, at the end very of the list one can see a Move Option:
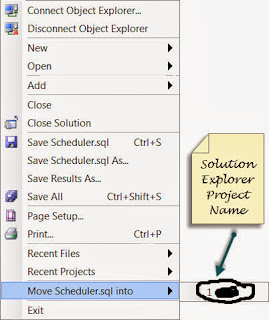
The Purpose of the Move option is to take your current active query file and move it one of your active projects in solution explorer. Once you choose the project the query gets added to the project in solution explorer. One of the nice things about this option is that it allows to quickly place the .sql to the project instead of going to the solution explorer and adding it. I have highlighted the query file after getting placed in the project.


Wednesday, November 6, 2013
CDC Update & TFS 2013
In my previous blog post I had mentioned about the CDC Session I had attended. One of the important points which was pointed out during the session was the realtion between the database recovery mode and CDC in sql server. When a Database is in Bulk logged or simple recovery mode and CDC need to be performed on the tables in the database, the recovery model changes to fully logged. The reason being the CDC has to read the log before the log backup otherwise the whole purpose of CDC would be lost. One more key point need that need to be kept in mind is that there is no overhead for CDC in sql server.
The other topic which I would like to discuss in this post is that of Team foundation Server 2013. There has been quite a bit of changes to TFS 2013. One of the main aspect of TFS 2013 is that there is now a web based interface for working with TFS. When you log into TFS 2013 on the web there is a dashboard which presents menu options such as Home, Code,Work,Build, Test. There are online team rooms which people working on a project can chat/discuss about the different changes that happen to the code base. It provides a collaborative way of working by using the web interface and provides a list of activities that need to be performed along with the members who belong to the project. Please see the couple of images below to get an idea of the web based interface for TFS 2013.

The other topic which I would like to discuss in this post is that of Team foundation Server 2013. There has been quite a bit of changes to TFS 2013. One of the main aspect of TFS 2013 is that there is now a web based interface for working with TFS. When you log into TFS 2013 on the web there is a dashboard which presents menu options such as Home, Code,Work,Build, Test. There are online team rooms which people working on a project can chat/discuss about the different changes that happen to the code base. It provides a collaborative way of working by using the web interface and provides a list of activities that need to be performed along with the members who belong to the project. Please see the couple of images below to get an idea of the web based interface for TFS 2013.


Thursday, September 26, 2013
PowerPivot,PowerViewer and Excel 2013...
I finally got to install the office 2013 suite and the first thing i was curious to check out was tie in to the Powerpivot and Powerviewer tools. These 2 were integrated with Excel 2013, there has been a lot of discussion about this especially the Powerviewer piece and whether it needs to be tightly integrated with Excel. In Excel 2013, under the File /Options menu, there is a section for Add-on. In the list of Add-on, one will be able to see the add-on for Powerpivot and Powerview. Click on the check box right beside the add-ons. In the bottom portion of the screen, there is a drop down to manage add-ons, one would need to choose COM Add-on and then click ok at the bottom of the screen.

The next screen is where one can make the Add-ons Active, click the check box next to add-ons and click Ok. Once this is complete, one should be able to see the PowerPivot option on the Menu. Click on the PowerPivot Option, there will be a Manage option on the main bar. Once you click the Manage option, there will be a new window which will be presented to manage the database connection and do the data analysis.

![]()


The next screen is where one can make the Add-ons Active, click the check box next to add-ons and click Ok. Once this is complete, one should be able to see the PowerPivot option on the Menu. Click on the PowerPivot Option, there will be a Manage option on the main bar. Once you click the Manage option, there will be a new window which will be presented to manage the database connection and do the data analysis.


Thursday, September 12, 2013
Data Dictionary
In today's world of data management, business intelligence, data warehouse the amount of data is growing along with the amount of attributes being captured. It becomes very important to have proper data management principles in place. One of the aspect is data dictionary, it is very important to persist the information which would make it easier for users to access. This would enable in finding out what attributes are being made available and where they are sourced from. I would like to explain one of the ways it has been done projects I have been associated with. First thing is there is a template that would capture information regarding source systems in terms ( Database, Table,Server). In addition to this would where the table would end up, sometimes there is a landing area where information first comes in and then the data would be moved into the user databases. The information pertaining to Landing databases, tables, server need to be captured. At this stage one would identify key columns, if the attributes are NPI/Non NPI, if the attributes are Nullable/Non Nullable. Once this is done in the template we would capture the data type/scale information. One of the important in the template would be how each table would be loaded. A table can be loaded in full meaning it is refreshed everyday or we get changed information , only record that changed. Once all of this information is captured in a template (in excel), the information can be validated using a set of rules (database standards). One of the ways which this can be done is through macros in excel (assuming the template is maintained in this format), any errors would be displayed across each entry in the DD. Once the errors are fixed, the macros can be used to generate SQL Statements. These SQL Statements can be used to persist meta data information in the database. I have found the concept of data dictionary and persisting them in a database for Data Integration Projects.
Key Information:
Source Server/Database/Tables
Landing Server/Database/Tables
User Database/Server/Tables
Column data type/scale/size information
Key Colums/NPI/Non NPI columns
Type of Data Load.
Key Information:
Source Server/Database/Tables
Landing Server/Database/Tables
User Database/Server/Tables
Column data type/scale/size information
Key Colums/NPI/Non NPI columns
Type of Data Load.
Monday, August 26, 2013
Reporting Requirements...
In today's Business Intelligence world, there is a lot of requirements for reporting. There are lot of different types of reporting which includes adhoc,operational and discovery analytics reporting. In order to handle reporting requirements effectively one needs to have a strategy of how reports will be deployed and presented. One of the options is to have a Reporting Dashboard on a SSRS reporting Portal, the other options is to have a Sharepoint based Dashboard/Portal having key reports. The other aspect apart from Presenting the reports is how does one go about gathering requirements for reports. The following points/questions could be followed:
1. Decisions to be made with the Report.
2. Report Samples.
3. What is the report generation Complexity (This can be used to gauge the amount of development effort involved).
4. Report Complexity- This follows point number 3 very closely. This could given idea of what types of data sources are involved to get data for reports.
5. The Estimated number of users for the reports.
6. Report Distribution Channel .
7. Frequency of Reports.
8. Business Logic for Reports and anticipated frequency of change for Business Logic.
9. Is there a need for BI Solution (Cube Based Reports, Discovery analytics, Adhoc, Canned/Near Real time)
10. How are Reports Generated.
The above 10 points could be used as a guide for gathering reporting requirements and the feedback for these questions can give pointers to what type of reporting is required and can be generated. The list of points given is by no means exhaustive, these are some broad pointers.
Thursday, March 14, 2013
SQL Server - Index Fragmentation...
One of the issues we run into when data starts growing in sql server tables is with the issue of Index fragmentation. One of the reasons this could happen is while designing the table and the type of indexes if proper thought and research is not done with the data going into the table(s). It is very important to understand the nature of data, the growth of data that can occur before loading the data into a table. It is also essential to come up the right type of indexes and fill factor. Sometime even with best case scenario index fragmentation can occur. One of the things to stay away from is to use to the standard maintenance plans that come out of the box with sql server. It is very essential to understand the server and database characteristics before designing a maintenance plans. The one thing that folks normally do is to drop and rebuild indexes on a fragmented table, there is a cost associated with rebuilding indexes.Before one decides to rebuild/reorganize indexes one should detect the level of fragmentation and see what kind of thresholds one has set up for the current database environment. One could use the following example SQL:
SELECT a.index_id, name, avg_fragmentation_in_percent
FROM sys.dm_db_index_physical_stats (DB_ID(N'TestDB'), OBJECT_ID(N'dbo.Customer'), NULL, NULL, NULL) AS a
JOIN sys.indexes AS b ON a.object_id = b.object_id AND a.index_id = b.index_id;
Once the average fragmentation percent is determined, one can decide to either reorganize or rebuild the indexes. One of the popular free tools available to do Index Defragmentation and other database maintenance activities is to use the following link:
http://ola.hallengren.com/
The scripts developed by ola have been very extensively used, it is popular in the SQL Server Community and has won lot of awards. Take a moment to check it out, it covers all editions of Microsoft SQL Server 2005, SQL Server 2008, SQL Server 2008 R2, and SQL Server 2012.
I had started a discussion in Linkedin on Index fragmentation in the Microsoft Business Intelligence group.
http://www.linkedin.com/groupAnswers?viewQuestionAndAnswers=&discussionID=223676112&gid=59185&commentID=127091755&goback=%2Egde_59185_member_223676112&trk=NUS_DIG_DISC_Q-ucg_mr#commentID_127091755.
There have been very good suggestions given by SQL Server experts for the question I asked. Please read through the above link mentioned in linkedin, gives one very good perspectives.
Wednesday, January 16, 2013
T-SQL (INSERT)-SQL Server 2008
T-SQL has constantly evolved right from its very beginning and there are lot of new features that have been added to T-SQL over the years. I was working on a project where in I was creating a stored procedure and was writing INSERT sql. There was a need to capture the value inserted into a table and assign that value to a variable. In the INSERT t-sql statement there is a option called OUTPUT, what this clause does is it has access to the inserted table. This is very similar to how inserted table is available in Triggers. The purpose of the inserted table is hold the value that been just Inserted. For example a INSERT Statement with an output clause could look like the following:
INSERT INTO dbo.TestTable
(BatchId,
ServiceId)
OUTPUT inserted.BatchId,inserted.ServiceId
SELECT BatchId,
ServiceId FROM dbo.LookupTable WHERE ProcessName = @ProcessName.
In the above example the value of BatchId and ServiceId is being routed to inserted table with the columns BatchId and ServiceId. Now just having these in inserted table would not of much value, these need to be captured. In order to capture the values once can extend the INSERT statement in the following way:
INSERT INTO dbo.TestTable
(BatchId,
ServiceId)
OUTPUT inserted.BatchId,inserted.ServiceId INTO @out(BatchId,ServiceId)
SELECT BatchId,
ServiceId FROM dbo.LookupTable WHERE ProcessName = @ProcessName.
In the above example the values in the inserted table are being routed to a table variable with the 2 columns.
Once the statement is executed one can get the values from the @out table variable.
SELECT BatchId,ServiceId FROM @out.
The above feature gives a elegant way to capture information from a INSERT statement. The above set of queries were executed on SQL Server 2008.
INSERT INTO dbo.TestTable
(BatchId,
ServiceId)
OUTPUT inserted.BatchId,inserted.ServiceId
SELECT BatchId,
ServiceId FROM dbo.LookupTable WHERE ProcessName = @ProcessName.
In the above example the value of BatchId and ServiceId is being routed to inserted table with the columns BatchId and ServiceId. Now just having these in inserted table would not of much value, these need to be captured. In order to capture the values once can extend the INSERT statement in the following way:
INSERT INTO dbo.TestTable
(BatchId,
ServiceId)
OUTPUT inserted.BatchId,inserted.ServiceId INTO @out(BatchId,ServiceId)
SELECT BatchId,
ServiceId FROM dbo.LookupTable WHERE ProcessName = @ProcessName.
In the above example the values in the inserted table are being routed to a table variable with the 2 columns.
Once the statement is executed one can get the values from the @out table variable.
SELECT BatchId,ServiceId FROM @out.
The above feature gives a elegant way to capture information from a INSERT statement. The above set of queries were executed on SQL Server 2008.
Monday, January 7, 2013
SSIS - Audit Transformation...
In ETL operations/Design it is pretty obivious that there is a lot of need for auditing the data that is bought into Data Mart/Data Warehouse. In certain cases depending on when the data is fed into a Data mart lot of business transformations happen. While working on a SSIS package for one of my projects, i came across a task available in the Data flow of SSIS. The task is called Audit Data flow component. In order to use this component, one needs to attach this component to the out put of a say a input data source. What is essentially being done is, in addition to the input columns that is being derived from the input source, one can add additional ausit columns. For example: In my project I had a Flat file input source, so the first step was to drag and drop the flat file source into the Data flow and setup the path and the input columns. Once this was done, to the output of the flat file source I connected the Audit Data Flow component like the image show below:

Now in order to add the audit columns to the input data source, right click on the audit data flow comonent, the audit transformation editor opens up. In the editor I added the audit columns I needed to be part of the destination data, please see image below:

This Data flow component provides nice addition to capabilities of SSIS , in case one wants to add audit information the data to be stored in Data Mart/Warehouse.
Thursday, October 18, 2012
SQL Server DB Compare Tool...
When working on database/data warehousing projects one gets to work on multiple environments Development,QA,UAT and Production. One of the tasks that is usually done very frequently is that of comparing database objects. In a database/datawarehosuing project the database objects get constantly moved from one environment to another environment and very often there is schema's on the different environments need to be compared to see if there are any differences.I was referred to a tool by a SQL Server blog Contributor/Developer Imran Mohammad. I decided to check the tool out as I am currently doing lot of data sourcing projects where in I have to do lot of database comparisons. The name of the tool is called SQLDBDiff the link for the tool is given below: In the website there are two versions of the tool listed, the freeware and shareware version. The site lists the differences between the two versions, I decided to download the freeware version.
http://www.sqldbtools.com/Downloads.aspx?ProductId=1
The freeware version is in the form of .zip file and I extracted the files and ran the Compare Databases Tool (the file is called SQLDBDiff). In the Menu Option File one has to choose Compare two databases, this launches a window where one can connect to the source and target databases. Here the source and target databases are the databases where tables and other objects need to be compared. Once these values are filled out there is Options button where in one can check what type of database objects need to be compared.

There are a good set of Preferences ranging from tables to Server Properties. There is a Compare options tab where in one can choose options like whether system objects, statistic indexes need to be included for comparison. Once these are all set click the OK button to start the comparison, once the comparison is complete there is a set of tab based windows which appear with the list of objects which have been compared. In each row of the screen one can double click to see the details of the comparison and there is a status column which tell the user the result of the comparison (whether it was the same (green) or not (red)). The freeware version should be good enough for one to get started, in case there are more detailed features like Generate schema and Data synchronization scripts one can get the Shareware version.
Tuesday, October 2, 2012
SQL Server Database Testing...
One of the tasks that is vital once Development is complete as part of a database development project is testing. There are different types of testing on Database Development projects that involve stored procedures, functions,Views and tables. Initially lot of the testing was based on sql scripts which would have been developed for different scenarios. Lot of the database testing which I did was done primarily using SQL Scripts. These days lots of development shops have adopted Agile Framework wherein the Testers and Developers need to be really co-ordinated. Recently there are tools that are being developed for Database Testing which provide lot more options and flexibility. One of the tools that i came across was SQLTest From Red Gate Software. I have used tools developed by Red Gate and have found them very useful and efficient. Here is the link for SQL Test: http://www.red-gate.com/products/sql-development/sql-test/. The main purpose of the SQLTest tool is to develop unit test cases scenario and execute them in a more user friendly manner. As quoted by Red Gate: With SQL Test you can discover defects much earlier in the development cycle and make continuous integration, agile development, and test-driven development achievable goals. SQLTest is powered by tSQLt which is a framework developed by Red Gate. One of the feature which I like is the ability to check the test cases into SQL Source Control which is a another offering from Red Gate. SQL Source Control can be connected to the following:
SVN
Vault
TFS
Perforce
Git
All others
Mercurial
Please use the link : http://www.red-gate.com/products/sql-development/sql-source-control/ for further information. As Database projects continue to grow in complexity testing of database development projects have become all the more important so that integrity and accuracy of the data will be maintained.
Friday, September 28, 2012
SQL Saturday in Charlotte...
One of the neat things about the SQL Server community is ability to share knowledge and advice through community events. SQL Saturday is a neat concept where in on a Saturday SQL Server related topics are presented and discussed in a city. This gives the ability for the folks who tight on budget to attend the SQL Saturday events and get good information and also network with othe SQL Server Professionals. BI has grown tremendously over the years and the number of folks working with SQL Server BI is increasing and growing. On Oct 27,2012, sql server saturday BI edition is going to be held at Location: Central Piedmont Community College (CPCC), Levine Campus, 2800 Campus Ridge Road, Matthews, NC 28105 (located in South Charlotte). Please see link for additonal details about the event and the schedule of topics/speakers.
http://www.sqlsaturday.com/174/schedule.aspx
Hope folks who are attending get benefited from the above event.
http://www.sqlsaturday.com/174/schedule.aspx
Hope folks who are attending get benefited from the above event.
Subscribe to:
Comments (Atom)