Showing posts with label SQL Server. Show all posts

Thursday, August 13, 2015

Azure ML Studio - Part 2

In continuation of my earlier blog post related to Azure ML studio, I would like to describe some additional components that can be used while setting up an experiment. One of the main components available in the Experiment designer is called Statistical functions. This section has a set of multiple functions to choose from, they range from Elementary Statistics to Hypothesis testing. These components would typically used once the dataset has been cleansed to an extent so that one can accurate readings of the data from the experiment. Please see the image below. In this example after executing an R-Script the output is fed to an Descriptive Statistics module.

The Descriptive statistics module typically can include Counts, Range, Statistical Summaries and Percentiles. Once the descriptive statistics is completed, the output can be stored on a variety of formats and this is provided by the writer component. Please see the image below. The Data destination can be

Azure (SQL Database, blob storage, table), Hive Query. Each format has its own advantages and for more info, one can refer to the link here: https://msdn.microsoft.com/library/azure/7a391181-b6a7-4ad4-b82d-e419c0d6522c


Monday, June 8, 2015

DataZen-Microsoft

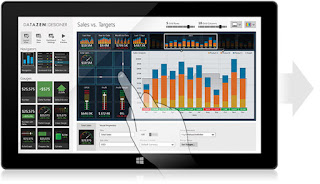
Datazen is a Mobile product that allows BI on Mobile as per the website: Datazen Windows 8 app enables dashboard creation and publishing based on Excel, cloud and enterprise data sources. After publishing to a Datazen Server, dashboards and KPIs are accessible on any device via its native app, or through any major browser. The Mobile app can be downloaded for ios/andrioid and windows phones. For example: I downloaded the Datazen app on my andrioid smartphone. Once the app is downloaded when I launched the app, it connects to a demo server. The App pulls down a set of demo KPI and dashboards. This provides an overview of the type of dashboards that can be built with DataZen. Recently Microsoft has acquired Datazen, this would enable Microsoft to provide a robust BI offering in the mobile space. Datazen server requires Windows Server,IIS and .NET as the prerequisites. Please look at the image for a sample of what is possible with the Datazen tool.

The Datazen link is : http://www.datazen.com/overview/, all the details are available here.
 
There is a detailed blog on capabilities of Datazen by SQL Server Expert: Melissa Coates at her blog site: http://www.sqlchick.com/entries/2015/6/3/prototyping-layout-and-design-with-datazen. This blog post specifically talks about Prototyping and Design with Datazen.

Monday, March 17, 2014

Cloud Services...

I was on a emergency trip to take care of my father, during the flight met some individuals who are offering different types of cloud based services for different types of companies. They were were upbeat about the adoption of cloud based technologies. With Microsoft Satya Nadella stating the emphasis on cloud based and mobile offerings, this is a space to watch out for. I am enclosing a link on a demo of Azure by MVP TroyHunt:
http://www.troyhunt.com/2014/03/the-worlds-greatest-azure-demo.html. He very nicely lists out the 14 different steps required to set up Azure and has provided a video as well.

Monday, May 13, 2013

SSIS Vs Store Procedure/T-SQL

One of the interesting debates/discussions which happen while discussing an SSIS implementation/Strategy is whether to use SSIS as a shell and do majority of the work the transformation/loading work done by SQL/Stored Procedures. The second option is to leverage the features in SSIS package and reduce the amount of TSQL/Stored procedures. In order to arrive at a optimum solution there are certain key points that need to discussed. The first would be the requirement from SSIS solution, in this there could be the following sub categories.
1. What would be the frequency of Data load into the target system.
2. What type of transformation is required.
3. What would be the requirement for the availability of data to the users.
4. What type of hardware is available at this point and how does it play into the requirement.

It is very important to understand the capabilities of the tools available while building the SSIS solution. Each piece of the ETL toolset would have a capability, positives/negatives, it is very important to understand them.
SQL/Stored Procedures are very good at performing SET based operations and CRUD operations. SSIS is very good at doing parallel processing, String based transformations, lot of functions for different type of operations based on data types, also it is graphical in nature. It is also very important to perform lot of testing while doing a SSIS implementation to get a good understanding of performance in the given server/hardware environment. With respect to transformations, get a good understanding of the complexity of the transformations required by the ETL solution. It would also be highly recommended to look at the metadata of the data sources and destinations and see if any design patterns can be arrived at. From a developer's view point it is important to understand the level of code maintenance involved.

In case you to get more insigh into SSIS best practices, please look into the discussion in Linkedin:
http://www.linkedin.com/groupAnswers?viewQuestionAndAnswers=&discussionID=236893667&gid=59185&commentID=137243006&goback=%2Egmr_59185&trk=NUS_DISC_Q-subject#commentID_137243006
There are very good points listed in the link above by different SQL Experts, it is worth checking it out.

Monday, May 6, 2013

Analytics Reporting and Dashboards...Part 2

In continuation with my earlier blog post, I had the opportunity to get references to some more Analytics reporting and dashboard products. The good news is there is a wide range of tools, also all of them have offerings for the growing Mobile and tablet market. There is a increasing need for delivering BI Solutions on mobile platforms. The 2 Products I have checked out so far has been Strategy Companion (this works on Windows 7 Professional and Enterprise OS, the software does not install on Windows 7 Premium) and bioXL from Pyramid Analytics (has similar set of requirements from Strategy companion). The web site for strategy companion is www.strategycompanion.com. They have products which work for mobile platform as well, they have very good demo videos on the web site and a very helpful support staff. Once you register for a product download they also offer setup support videos which are very useful. They have 3 products Analyzer enterprise, Analyzer Saas and Analyzer mobile. The web site for Analyzer Mobile is http://strategycompanion.com/analyzer-mobile/ and to quote from the web site: Using a “Build Once – Deploy Everywhere” approach, Analyzer Mobile™ enables you to easily provide mobile BI supporting iPads, iPhones, Android smartphones and tablets, BlackBerry smartphones and tablets and Windows Phone 7. No software of any kind needs to be downloaded to anyone’s desktop or mobile device in order to build or deploy your mobile BI reports and dashboards. I found the demos very impressive and would definitely check out more of this product. There other vendors who have product offering in the same space:
They are CALUMO (http://www.calumo.com), their product offerings range from Reporting/Analysis to Dashboards and KPI's. The line up of products are CALUMO for SSAS, CALUMO Skylights and CALUMO Sparks. The company also offers products for Mobile BI Capabilities.
The next vendor I would like to mention is TARGIT,  http://www.targit.com/en, they have products offering wide range of capabilities, http://www.targit.com/en/Experience-TARGIT/Products/TARGIT-BI-Analytics/Features-Overview, they state that they do social analytics as well, these days there a lot of effort being directed towards getting valuable information from Unstrucutred data. The product which supports SQL Server can be downloaded from http://www.targit.com/en/Experience-TARGIT/Try-TARGIT/With-NAV-cubes.
I am have been spending my time trying to get through these products in terms of features, each one of them look impressive in terms of capabilities. In case anyone of you know more about these products please do drop a comment and share your experiences.



Monday, April 29, 2013

Analytics Reporting and Dashboards...

Recently I started a topic on Microsoft Business Intelligence forum in LinkedIn regarding having a common tool for doing SSAS cube reporting, relational reporting,charts and may be Pivot tables. It was a interesting discussion with comments raging from should we a need a all inclusive tool or have separate tools for different types of reporting. The reason i wanted to bring up this topic is because of the recent announcement of different tools from Microsoft starting with Powerpivot, then Powerview , GeoFlow and also more importantly placing Excel has a central BI tool for self service BI analytics. During this discussion I was sent a link to http://www.pyramidanalytics.com/. One of the much talked about topic in past was when Microsoft decided to end Proclarity and use PerformancePoint as a primary dashboard tool. There were lot of folks who were upset with that move and had been long yearning for a tool like Proclarity. Pyramid analytics has tool called bioXL, quoting from the company's website: Pyramid Analytics bioXL allows users to rapidly query both multi-dimensional and tabular OLAP cubes in SSAS and PowerPivot. Users can view trends, quickly isolate and investigate issues, drilling down to details as required or drill across ("dice") through data dimensions in a tool that reflects all the classic requirements of a cube viewer built with today’s technologies and application design concepts. I feel it has lot of features and potential to be used for Analytics reporting. Here is the link for http://www.pyramidanalytics.com/products/bioXL.aspx, they also offer another product such as bioPoint. In summary there are vendors like pyramidanalytics who have come up with a product to fill the void created by Proclarity.


Monday, April 22, 2013

Tableau and Microsoft BI...

One of recent trends in the space of BI has been the use of tablets to display dashboards and enable business managers to get to know important business metrics on the fly. Adding strength to the Mobile BI space has been the fact that the recent increase in the shipments of tablets , at the same time a drop in PC shipments. Presently business is looking to extend BI capabilities for its user base by wanting to get BI solutions deployed to different platforms/devices. Microsoft at this point has not really gotten into the Mobile Space domain yet but there is a way to extend Microsoft BI to Mobile. Here is a link below where in Jen Underwood from Tableau elaborates on how Microsoft BI on Mobile can be achieved. It is called Tableau and Microsoft BI for Mobile BI. I have extracted some key points from the blog:

1) Tableau’s touch-optimized, business intelligence is available across a wide array of mobile device types, browsers, and operating systems including Windows, iPad and Android - native apps and browser based.  In the BYOD world we live in today, having wide device support is critical. Don't limit your mobile BI consumers to one device type.
2) Mobile users can view, edit or even author new visualizations on their favorite mobile tablets to not only view data but also ask on the fly questions in meetings or while on site to get immediate answers.
Read on further at the link below:
http://www.jenunderwood.com/blog.htm#TableauMobileBI

Friday, April 12, 2013

Excel - 3-D Data Visualization

There has been a ever increasing flow of Data visualization tools in the market. The tools become more effective if the data beneath the tools are clean and meaningful. The most recent version of Tableau has options to connect to Big Data sources and help users analyze such data, Big data has been a important space for a lot of vendors, of course there is a hype factor too. Microsoft recently announced a public preview of a tool called GeoFlow. As per Microsoft: “Geoflow” is a 3D visualization tool that helps users map, explore and interact with both geographic and chronological data, enabling discoveries that could be difficult to identify with traditional 2D tables and charts. Moreover, “Geoflow” emphasizes visual storytelling through collaborative features that show changes in data over time with beautiful screenshots and cinematic, guided video tours.

The output of Geoflow looks pretty slick, I would be interested in knowing how much value 3-D Data visualization provides (I guess the video tours would be very effective). Please check the link below to find out what GeoFlow has to offer, currently it is available along with Excel 2013.
http://www.bing.com/blogs/site_blogs/b/search/archive/2013/04/11/geoflow.aspx
I took the picture from the link above...

clip_image002


Monday, February 25, 2013

SQL Server- Soft Skills...

The reason i choose this blog title was because of the numerous opinions raised by lot of folks in the industry stating that in order for one to be competent one needs to able to clearly articulate his ideas and communicate effectively. This blog post is going to highlight the importance of communication and presentation and use one of the blog posts written by a SQL Server Adam Machanic to substantiate this line of thought. The article written by Adam is excellent and very detailed. Please feel free to check out the link below to find out his thoughts on capturing attention. Here is the link below:
http://sqlblog.com/blogs/adam_machanic/archive/2013/02/22/capturing-attention-writing-great-session-descriptions.aspx?CommentPosted=true#commentmessage
Hope you find it useful just as I did by reading through the article. I will return to writing more detailed technical articles in my next post.

Wednesday, January 9, 2013

In Memory Analytics - Part 2

In my earlier blog post i had written about In Memory Analytics and the tools provided by Microsoft which uses in memory analytics. This segment is becoming increasingly popular with new offerings from different companies. I guess with the cost of memory and disk space storage becoming cheaper there could be a plenty of in memory product offerings. One Such Product offering which is outside of Microsoft is from Salient , http://www.salient.com/our-technology/. To quote from the website:
"Salient has pioneered a new business intelligence paradigm that merges the unique thought process of each individual with advanced data visualization. This enables everyone – non-technical as well as technical – to interrogate the data in order to discern patterns, trends and outliers. Users can understand the relationships among activities, costs and outcomes – and discover root cause in seconds."
One of their offerings is Salient ETL which allows one to move from Design to Automation in 3 easy steps. It sounds very interesting.
From Design to Automation in 3 Easy Steps:

•Design based on business objectives
•Map source data to the logical design
•Automate updates of the data feeds
In Summary in the year 2013 there going to be lot of offerings in the In memory analytics and Big Data Domain.


Tuesday, September 4, 2012

DBVisualizer-Database Management Tool

When it comes to Database Management there are lot of tools out there. Database Management is one of the key activities performed by Database Administrators, Developers and Architects (depending on the Situation). With respect to SQL Server there is SQL Server there is SQL Server Management studio, now there are times situations where one need to connecto to multiple data sources. This would hold true when one is working on ETL/DataWarehosuing/Data Sourcing projects. One of the tools I recently started using (since I am working on  multiple Data Sourcing projects) is Database Visualizer. This product is available from http://www.dbvis.com/, DbVis Software. In the web site mentioned before there is a DBVisualizer Personal Edition Download available for 21 days free. The Installation of this software is pretty straightforward, one of the activities that need to be completed after installing is to make sure the drivers for the data sources are installed as well. When the software is launched we get the following screen:


In order to create a database connection , click the + icon on the toolbar, then we have screen to enter the database connection information. One of the options available is Database type as seen in the screen below.


When it comes to Database type there are bunch of options available like the ones listed below:  there are also options for SQL Server as well.

Once the database connection has been created, there options available for SQL, Scripts and other Database Management functions. One of the features that appeals to me is wide variety of connectivity to different data Sources.

Thursday, June 14, 2012

SQL Server-Tuning

Recently I ran into an issue with a SSIS package. One of the Exceute Sql task was insert records into a table from a view on a sql server database. In the last few days the package started failing frequently and it was on the execute sql task inserting records, the error reported in the job logs was a network error. I started examining the source view and looked at the select statement of the view. I noticed somethings write way: The view was using other views, each view in turn were referencing 4-5 base tables,also there was one view which was used repeatedly in the joins. When i ran the Select statement from the view it took over 20 mins to bring the data back. I knew that nested views could be causing the slowdown, analysed the join and indexes. I took the view which was used again and again the joins, converted them into a CTE of its own. Once the CTE was created the data was inserted into a temp table. Once this was completed, the remainder of the view was converted into another CTE. Then i combined the temp table created earlier with the CTE and ran the query. The data was retrieved in less than 2 minutes which was a huge performance gain from earlier. One of the takeaways from this exercise was that when using a VIEW as a source, the underlying SQL of the view needs to be examined. In case there is nesting of views, there could be a different way to model the data that is needed. To summarize this was a very interesting exercise of performance tuning.