I had the opportunity to attend the SQL Saturday Event in Charlotte, NC on September 17, 2016. The event was very organized and hosted by a hard working/talented team of volunteers. There were a variety of topics spread across different aspects of SQL Server, Business Intelligence and Data Analytics. There were 3 sessions which I found very informative and Interesting. The 3 Topics were across Data Analytics, Machine Learning and Master Data Management (Microsoft).
The first topic which i attended was from SQL Server/Data Analytics Expert Jen Underwood (Please visit her excellent blog http://www.jenunderwood.com/ for more information/trends in Analytics), the topic was on trends in the Analytics Industry. The topic covered the skill sets/domains currently hot/growing in the Data Analytics/Big Data space. There were interesting demos on how certain jobs can be automated,also how robots are beginning to permeate different as aspects of human life and how they are helping out in areas of customer service.here is a link to robot video which has human like expressions and interactions:
Robotics. The interesting aspect of this demo is that rather being just machine like, the robot interacts in a very human like fashion. These type of robots could replace jobs that can be easily automated. There were other aspects covered about the cloud, Machine Learning and Predictive Analytics. One of the other interesting area that was mentioned was the area of immersive data visualization. This is where the concept of 3-D visualizations can be used to analyze and understand data. One of the visualizations that was shown was the stock market rise and fall during the past several years, also it showed the crash of the stock market in 2008 in a roller coaster ride simulation. Here is the link for the demo: http://graphics.wsj.com/3d-nasdaq/.This is a virtual reality guided tour of 21 years of the Nasdaq, very interesting concept. One of the thoughts that went through my mind was that how much of such visualizations would work in certain types of business/organizations. On the whole the topic was very informative with respect to what is coming in the Data Analytics space and how one needs to be prepared.
The second session was on Master Data Management by Rushabh Mehta (SQL Server Expert, Past SQL Pass President, Independent Consultant/CEO). This topic was a presentation on the very important but often ignored topic of data management. In this presentation Rishabh went through why Master Data management is important and discussed one of the projects he did for his client. In this project he explained the process of data Cleansing, how records could de-duplicated and usage of standardized services from Melissa Data Services. Melissa Data Services provides services around Address, Name Standardization, these are very useful when one tries to created a master record for a customer. Here is the link for Melissa and the services they offer: http://www.melissadata.com/. The session also provided insights into how a master record could be created for companies, here services offered by Dun and Bradstreet were used. Overall session was very informative and conveyed the importance of Master Data Management.
The third session which i found very useful was the Session on Machine Learning with R by Paco Gonzalez,Corporate Center of Excellence, Program Manager at SolidQ. The session was very informative and very nicely presented. Paco Touched upon how tweets from twitter can be imported and analyzed to determine the sentiment of a particular topic/product being discussed. He took an example of product that was being sold in a online cloth retailer website and how tweets regarding this particular product can be scanned to understand whether folks are talking good or bad about the product. He mentioned that one would get the feeds from twitter and also request Twitter for data relating to particular has tags. Paco also presented case studies on how Machine learning can be used to determine if a particular would be with a bank or leave the bank. He demonstrated how past patterns can be used to train a model and use test data to determine the accuracy of the bank model. The R integration with SQL Server 2016 seems to be very interesting and exciting, now one has the power of getting predictive results by executing stored procedures.
There was demo of the Microsoft Cognitive Services that can be used for analysis of text, face and emotions:
here is the link: https://www.microsoft.com/cognitive-services.
Overall a very exciting SQL Saturday and a very good information gathering session.
Showing posts with label R Programming. Show all posts
Showing posts with label R Programming. Show all posts
Monday, September 19, 2016


Saturday, March 19, 2016
Experiments - Azure ML Studio
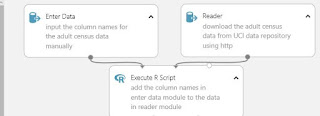
Azure ML studio is very intuitive and a powerful tool that can be used for performing different type of data analysis experiments. The Studio can be used to set up very basic experiments like descriptive statistics to performing complicated machine learning algorithms. The whole layout of the ML studio is very user friendly and in some ways remind me of the layouts in SSIS packages. I decided to setup a basic experiment in ML studio to perform certain descriptive statistics calculations on a sample data set. The dataset I used was adult census data from UCI repository and ran the data set through a R script component to data, once the data was massaged it was run through a descriptive statistics to perform descriptive statistics on each column. Once all the components are in place the experiment can be run in the ML studio to get the results. The data can be verified and if everything looks good, the experiment can be published as a web service and can be accessed by a say .NET program.
I have illustrated the experiment which i have set up in the ML Studio.

I have illustrated the experiment which i have set up in the ML Studio.


Hope this provides a basic overview of ML Studio. Azure ML studio opens up a lot of possibilities to perform different types of data science experiments and bring them more into the main stream.
Thursday, December 31, 2015
Big Data Trends in 2016...
First, I would like to wish the readers of my blog a very happy and prosperous new year 2016. Due to personal challenges i could not post much in 2015, i hope i can do better in 2016. Looking forward to how the year 2016 shapes up for analytics, if there are newer trends or consolidation of big and small technology firms in the analytics space. There were lot of strides made in data science, the programming language R has become increasingly popular across various industry domains, More business folks are beginning to understand the power of good models and how it can be pursued for predictive analytics. There were also strides made in bringing R and SQL Server together, this will be seen more in 2016 as we begin to see more valid business used cases.
Here is a link for the Top Big 3 data trends in 2016.
http://insidebigdata.com/2015/12/29/the-top-3-big-data-trends-of-2016/
Once again wishing everyone a very happy 2016.
Here is a link for the Top Big 3 data trends in 2016.
http://insidebigdata.com/2015/12/29/the-top-3-big-data-trends-of-2016/
Once again wishing everyone a very happy 2016.
Monday, November 16, 2015
Using Data Science Techniques with R- Zillow.com
R language has been gaining increasing popularity as Machine Learning, Predictive analytics take more and more importance within business. The applications of R has been steadily increasing in different industry domains. One of the areas where the R language is being very strongly used is in the are of Real Estate to predict selling prices of Homes Please read the link to blog post below related to how the company Zillow uses R for predicting estimates of prices for houses.
http://www.datanami.com/2015/08/12/inside-the-zestimate-data-science-at-zillow/
As the article indicates they use a mix of tools at different stages of the data value chain. The more cleaner the data is, the better the prediction is going to be.
http://www.datanami.com/2015/08/12/inside-the-zestimate-data-science-at-zillow/
As the article indicates they use a mix of tools at different stages of the data value chain. The more cleaner the data is, the better the prediction is going to be.
Saturday, October 17, 2015
Predictive Analytics-R Programming, SSAS Data Mining
Today i had the opportunity to attend the SQL Saturday Session in Charlotte today. It was a very well organized event with lot of topics ranging from SQL Development to Predictive Analytics. The interest in data science, big data and Predictive analytics seems to be growing rapidly. I attended some great sessions, first session i attended was R programming for SQL Developers presented by Kiran Math (Data Analytics Expert) from Greenville, SC. He currently works for a start up firm in Greenville, SC where he is working as a Data Analyst. He covered topics ranging from how to download R and R-Studio, did some comparisons between R and SQL Server in terms of commonalities around how data can be retrieved, filtered and aggregated. There was some coverage on the RODBC driver as well, this is the ODBC driver that can be used in R to connect to SQL Server Databases. In this blog post i would like to cover certain functions and packages in R that can be used for shaping the data and also removing bad values.The power of R language comes from the packages that are available. One of the packages is called dplyr, this can be installed by using the following commands:
install.packages("dplyr")
library("dplyr")
Once the above package is downloaded and installed, the following commands are available:
To Select the data from a dataframe in R:
select - select(df,product,vendor) - selects the columns product,vendor from data frame df.
filter - filter(df,product=="cars") - selects the rows where the product is equal to cars
mutate - mutate(df, saleprice= qty * price) - here the column saleprice is created by calculating using qty and price. These commands are useful for data profiling and creating columns as categorical variables in the data frame. Categorical variables are really useful while doing the modeling process. There are other functions within the dplyr package which can be accessed in this link: https://cran.rstudio.com/web/packages/dplyr/vignettes/introduction.html.
There is an another package called tidyr package which has lot of very useful functions, one such useful function is called gather: gather function takes multiple columns and collapses into key-value pairs, this really helps in shaping up the data.For example: let us say you want to compare sales prices of houses in different zip codes.
One of the other important packages is called ggplot2, it is a very important package that helps one to do advanced visualizations, this package relies on the concept of grammar of graphics where the visualizations are built by adding layers to enhance the plots. Please refer to the documentation here:
http://ggplot2.org/
The session on R was very informative and there was a demo on how to determine the sale price of a house that is 2500 sqaure foot in a particular zip code.
The next session i attended was on PowerBI architecture, implementation and usage. Melissa Coates, a SQL Server BI Professional/Expert provided an excellent overview of the PowerBI architecture and how the product has evovled with different features available in the On-Premise/Desktop and the cloud versions. There were really neat features that were demonstrated and how the reports can be shared within the organization/group of users. There are a lot of options available within the product that can be leveraged very effectively within the organization..
The session on Data Mining in SSAS was very effectively presented by Mark Hudson , Data Analytics/Data Mining expert from Captech. The terminology related to data mining was clearly explained to the audience so that we could take forward the concepts into the actual data mining models. The concepts related to continuous and discrete variables, does cor-related variables really cause causation were effectively discussed. Predictive modeling/Data Mining aim to produce predictions and not guarantee's. Next a baseball data set that pretty sizeable was used to demonstrate the data mining models. Here the data mining model was built directly using a query on a relational table in sql server database. One of the requirements for Data mining models is that there has to be a unique key per table, no composite keys allowed. He used the baseball data in a table as a source for the data mining models. For the demo he touched upon Decision Tree, Clustering and Naive Bayes algorithms. Currently SSAS data mining comes with 9 algorithms and is available in MultiDimensional SSAS only. Once the data is pulled into a data source view, the mining structure is built based on the columns pulled in and the attribute that needs to be predicted is selected along with other input variables. The variables that are not needed for the models can be removed at this stage. Once these were completed 3 mining models were built based on the algorithms (Decision Tree, Clustering and Naive Bayes) and executed. Once the models were built the results can be analyzed in the Mining Model viewer within SSAS and those can be used to validate the data set. The difference between SSAS and R is that while SSAS is more graphical and UI driven, R Language provides more control on how the models can be constructed from ground up and does involve more coding.
Overall the event was a great success in terms of learning, sharing and meeting with other SQL Server Experts.
install.packages("dplyr")
library("dplyr")
Once the above package is downloaded and installed, the following commands are available:
To Select the data from a dataframe in R:
select - select(df,product,vendor) - selects the columns product,vendor from data frame df.
filter - filter(df,product=="cars") - selects the rows where the product is equal to cars
mutate - mutate(df, saleprice= qty * price) - here the column saleprice is created by calculating using qty and price. These commands are useful for data profiling and creating columns as categorical variables in the data frame. Categorical variables are really useful while doing the modeling process. There are other functions within the dplyr package which can be accessed in this link: https://cran.rstudio.com/web/packages/dplyr/vignettes/introduction.html.
There is an another package called tidyr package which has lot of very useful functions, one such useful function is called gather: gather function takes multiple columns and collapses into key-value pairs, this really helps in shaping up the data.For example: let us say you want to compare sales prices of houses in different zip codes.
One of the other important packages is called ggplot2, it is a very important package that helps one to do advanced visualizations, this package relies on the concept of grammar of graphics where the visualizations are built by adding layers to enhance the plots. Please refer to the documentation here:
http://ggplot2.org/
The session on R was very informative and there was a demo on how to determine the sale price of a house that is 2500 sqaure foot in a particular zip code.
The next session i attended was on PowerBI architecture, implementation and usage. Melissa Coates, a SQL Server BI Professional/Expert provided an excellent overview of the PowerBI architecture and how the product has evovled with different features available in the On-Premise/Desktop and the cloud versions. There were really neat features that were demonstrated and how the reports can be shared within the organization/group of users. There are a lot of options available within the product that can be leveraged very effectively within the organization..
The session on Data Mining in SSAS was very effectively presented by Mark Hudson , Data Analytics/Data Mining expert from Captech. The terminology related to data mining was clearly explained to the audience so that we could take forward the concepts into the actual data mining models. The concepts related to continuous and discrete variables, does cor-related variables really cause causation were effectively discussed. Predictive modeling/Data Mining aim to produce predictions and not guarantee's. Next a baseball data set that pretty sizeable was used to demonstrate the data mining models. Here the data mining model was built directly using a query on a relational table in sql server database. One of the requirements for Data mining models is that there has to be a unique key per table, no composite keys allowed. He used the baseball data in a table as a source for the data mining models. For the demo he touched upon Decision Tree, Clustering and Naive Bayes algorithms. Currently SSAS data mining comes with 9 algorithms and is available in MultiDimensional SSAS only. Once the data is pulled into a data source view, the mining structure is built based on the columns pulled in and the attribute that needs to be predicted is selected along with other input variables. The variables that are not needed for the models can be removed at this stage. Once these were completed 3 mining models were built based on the algorithms (Decision Tree, Clustering and Naive Bayes) and executed. Once the models were built the results can be analyzed in the Mining Model viewer within SSAS and those can be used to validate the data set. The difference between SSAS and R is that while SSAS is more graphical and UI driven, R Language provides more control on how the models can be constructed from ground up and does involve more coding.
Overall the event was a great success in terms of learning, sharing and meeting with other SQL Server Experts.
Thursday, August 13, 2015
Azure ML Studio - Part 2
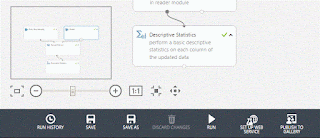
In continuation of my earlier blog post related to Azure ML studio, I would like to describe some additional components that can be used while setting up an experiment. One of the main components available in the Experiment designer is called Statistical functions. This section has a set of multiple functions to choose from, they range from Elementary Statistics to Hypothesis testing. These components would typically used once the dataset has been cleansed to an extent so that one can accurate readings of the data from the experiment. Please see the image below. In this example after executing an R-Script the output is fed to an Descriptive Statistics module.

The Descriptive statistics module typically can include Counts, Range, Statistical Summaries and Percentiles. Once the descriptive statistics is completed, the output can be stored on a variety of formats and this is provided by the writer component. Please see the image below. The Data destination can be
 Azure (SQL Database, blob storage, table), Hive Query. Each format has its own advantages and for more info, one can refer to the link here: https://msdn.microsoft.com/library/azure/7a391181-b6a7-4ad4-b82d-e419c0d6522c
The Descriptive statistics module typically can include Counts, Range, Statistical Summaries and Percentiles. Once the descriptive statistics is completed, the output can be stored on a variety of formats and this is provided by the writer component. Please see the image below. The Data destination can be

Friday, August 7, 2015
Azure ML Studio - Part 1
Data Science has been experiencing tremendous growth in the business world today, there is a tremendous scope/job opportunities for people with Data Science Experience. One of the challenges has been to learn the different components of Data Science since most of them involve lot of Statistical, Math, Data Mining Algorithms knowledge. Microsoft on its part has been working steadily expose data science for the programming public. Initially Azure was slow to take off, but now with growing cloud implementations, Azure has been experiencing a lot of growth. So Microsoft decided to use the Azure platform and provide Data Science tools for the programmers. One of the very effective tools that is offered is called the Azure ML Studio, this is a development environment for Machine Learning Model Development. The interface of this tool is similar to some of the Visual Studio tools provided earlier by Microsoft. In order to start using a the Azure ML Studio one needs to have a Azure account. The whole concept of Azure ML works on the concept of Software as a service. One can use the following link to learn more about the Azure ML capabilities:
https://studio.azureml.net/
Once you login to the azure studio, the first that will happen is that the workspace will be set up. There will be a + symbol at the bottom of the workspace, click on that to create your first experiment. You have a couple of choices here 1) You can create a blank experiment 2) You Can create a experiment based on the templates provided. The option 2 would help one to set up an experiment quickly and understand the various components of the experiment. When you choose from the samples, you can either open it in ML Studio and view it in the gallery. I feel tools like Azure ML studio provide a great first step in exploring the power of Machine Learning/Data Science.
 In the image above the column_name is the header in the csv file and the other below it are actual column names which would be used to assign it to the data set ready by reader component.

One of the components in the above image is the Enter Data component. This component is primarily used for defining column headings, these column headings can be used to assign to the data sets that are read through the Reader component. In this case in the Reader component, we are downloading a file from a website. Since in this example the headers of the file downloaded by Reader component were not user friendly, we use the Enter Data component to provide meaningful column_names. In this example we have used the column_names to be in the csv format. For example please see the image below for Enter Data component:
Monday, August 3, 2015
Tableau and R Integration...
Among the Data visualization tools, tableau is one of the leading tools which is used by lot of organizations in various capacities. The types of reporting range from operational to really sophisticated data visualizations combining various data sources. With R growing to be a language of choice for Data Science related activities such as Machine Learning and Data Mining, it is being integrated with a variety of Tools. Given such a scenario it was natural to expect the integration between tableau and R to happen. Please see the link below for a video on R and tableau integration.
http://www.tableau.com/new-features/r-integration
Quoting tableau" Tableau Server can also be configured to connect to an instance of Rserve through the tabadmin utility, allowing anyone to view a dashboard containing R functionality".
Also the link contains a whitepaper on integration between the two tools, please check out the same.
Lot of interesting things happening in the Data Science these days...
http://www.tableau.com/new-features/r-integration
Quoting tableau" Tableau Server can also be configured to connect to an instance of Rserve through the tabadmin utility, allowing anyone to view a dashboard containing R functionality".
Also the link contains a whitepaper on integration between the two tools, please check out the same.
Lot of interesting things happening in the Data Science these days...
Wednesday, July 29, 2015
SQL Server 2016 and R-Integration...Part 2
In this blog post I would like to continue the discussion which done in the Part 1 of the SQL Server 2016 and R-Integration. In this blog post I would like to discuss one of the important R Libraries that can speed up the learning process a little and get to analyzing the data more quickly. The library I would like to discuss here is called Rattle. The library rattle can be installed in R by using the following commands. The commands below can be executed within R-Studio. The R-Studio is a more UI friendly to work on R-Commands and scripts.
install.packages("rattle")
rattle()
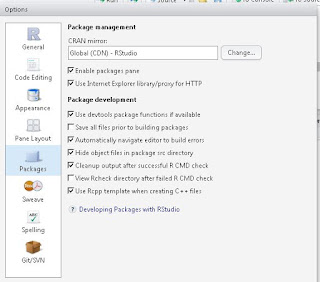
The install.packages() command in R will install all the files within the rattle library. In R-Studio one would set up the path to pull down the libraries as needed. As you can see the option for Use Internet Explorer Library/Proxy for HTTP is enabled.
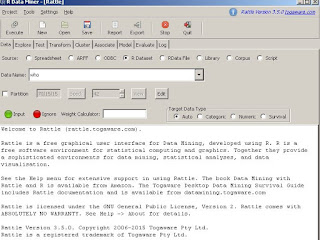
Once the package is installed, you can execute the rattle() function with the R-Studio, this will launch a GUI for rattle which has lot of useful options for doing data analysis. In the Rattle GUI as you can see there are lot of options that can be used for source of data, in the example below I am choosing the R-Dataset called who for analysis. Make sure to hit the execute option once you have chosen the data source from the drop down list.
In order to explore the dataset , use the explore tab and choose the summary option and I additionally choose Basics. These 2 options combined provides an quick overview of the dataset who by providing some important statistical data about the data set.

There are a lot more options available in rattle to do much more complex data analysis. As the integration between SQL Server and R continues, I am hoping such utilities are provided by Microsoft so that the data analysis can be more enhanced
install.packages("rattle")
rattle()
The install.packages() command in R will install all the files within the rattle library. In R-Studio one would set up the path to pull down the libraries as needed. As you can see the option for Use Internet Explorer Library/Proxy for HTTP is enabled.

Once the package is installed, you can execute the rattle() function with the R-Studio, this will launch a GUI for rattle which has lot of useful options for doing data analysis. In the Rattle GUI as you can see there are lot of options that can be used for source of data, in the example below I am choosing the R-Dataset called who for analysis. Make sure to hit the execute option once you have chosen the data source from the drop down list.

In order to explore the dataset , use the explore tab and choose the summary option and I additionally choose Basics. These 2 options combined provides an quick overview of the dataset who by providing some important statistical data about the data set.

There are a lot more options available in rattle to do much more complex data analysis. As the integration between SQL Server and R continues, I am hoping such utilities are provided by Microsoft so that the data analysis can be more enhanced
Saturday, July 18, 2015
SQL Server 2016 and R-Integration...Part 1
Earlier I had blogged about SQL Server and R can be connected to perform data analysis. Also in SQL Server 2016 there is supposed to be better R Integration. In today's market Data scientists/Data Wranglers are in great demand since organizations have piles of data and want to make sense of the data, also if data can provide valuable insights. Given these market trends and the push for aligning the business and data more closely it is important to have the analytic skills. In this blog I would like to provide an article which gives a flavor of sql server 2016 and R-Integration. In the link below:
http://blog.revolutionanalytics.com/2015/05/r-in-sql-server.html. The article describes SQL Server program managers Lindsey Allen and Borko Novakovic demonstrated a prototype of running R within SQL Server. For the R-Integration,Microsoft SQL Server has collaborated with http://www.revolutionanalytics.com/products. I hope you find the article and demo provided in the link above useful.
http://blog.revolutionanalytics.com/2015/05/r-in-sql-server.html. The article describes SQL Server program managers Lindsey Allen and Borko Novakovic demonstrated a prototype of running R within SQL Server. For the R-Integration,Microsoft SQL Server has collaborated with http://www.revolutionanalytics.com/products. I hope you find the article and demo provided in the link above useful.
Monday, May 11, 2015
SQL Server and R Integration...
One of the most popular languages in the Data Science Paradigm is the R language, there are plenty of resources and online classes being offered with respect to the R language. Once of the main advantages with the R language is that it is open source and can be downloaded on multiple platforms such as windows/Mac/Linux, also there is a very popular IDE for R called the R-Studio. SQL Server has been expanding to get into different domains one of them now being is Data Science. in SQL Sever 2016 there are lot more integration promised between R and SQL Server. In the mean time there are ways to integrate between R and SQL Server, here is a blog article on Simple talk by SQL Server Expert Feodor Georgiev, the article is titled: Making Data Analytics Simpler: SQL Server and R.
https://www.simple-talk.com/sql/reporting-services/making-data-analytics-simpler-sql-server-and-r/.
The article also provides a brief overview of the R language.
https://www.simple-talk.com/sql/reporting-services/making-data-analytics-simpler-sql-server-and-r/.
The article also provides a brief overview of the R language.
Subscribe to:
Posts (Atom)