Showing posts with label Data Virtualization. Show all posts
Showing posts with label Data Virtualization. Show all posts
Friday, September 16, 2016
Data Virtualization-Data Conditioning/Masking
These days business are expected to agile and have to deliver solutions quickly and efficiently. This means that while developing products it has to be moved through the different environments efficiently and quickly. There is also a lot of dependency on data in the test and lower level environments. The quality of data in the test environments need to good so that the applications using the data can be tested effectively. Often organizations run into challenges while populating data in Lower level environments either due to space issues and just the time taken to condition data takes a very long time, this thereby affects product delivery. This where products that specialize data virtualization come in. Delphix is one such product which enables organizations to effectively get production type data in test environments. Here is the website for the product:https://www.delphix.com/. According to the website: "Speed wins. It’s a simple fact. The faster you can deliver new applications, features and upgrades to market, the better your business performs. For that you need faster data. And for faster data, you need Delphix.". Please refer to the link below which explains the need for having such a product. https://www.delphix.com/why-delphix. As the nature of application development keeps changing, the quality of data needed for testing and other pre-production activities becomes very important and essential.
Saturday, October 17, 2015
Predictive Analytics-R Programming, SSAS Data Mining
Today i had the opportunity to attend the SQL Saturday Session in Charlotte today. It was a very well organized event with lot of topics ranging from SQL Development to Predictive Analytics. The interest in data science, big data and Predictive analytics seems to be growing rapidly. I attended some great sessions, first session i attended was R programming for SQL Developers presented by Kiran Math (Data Analytics Expert) from Greenville, SC. He currently works for a start up firm in Greenville, SC where he is working as a Data Analyst. He covered topics ranging from how to download R and R-Studio, did some comparisons between R and SQL Server in terms of commonalities around how data can be retrieved, filtered and aggregated. There was some coverage on the RODBC driver as well, this is the ODBC driver that can be used in R to connect to SQL Server Databases. In this blog post i would like to cover certain functions and packages in R that can be used for shaping the data and also removing bad values.The power of R language comes from the packages that are available. One of the packages is called dplyr, this can be installed by using the following commands:
install.packages("dplyr")
library("dplyr")
Once the above package is downloaded and installed, the following commands are available:
To Select the data from a dataframe in R:
select - select(df,product,vendor) - selects the columns product,vendor from data frame df.
filter - filter(df,product=="cars") - selects the rows where the product is equal to cars
mutate - mutate(df, saleprice= qty * price) - here the column saleprice is created by calculating using qty and price. These commands are useful for data profiling and creating columns as categorical variables in the data frame. Categorical variables are really useful while doing the modeling process. There are other functions within the dplyr package which can be accessed in this link: https://cran.rstudio.com/web/packages/dplyr/vignettes/introduction.html.
There is an another package called tidyr package which has lot of very useful functions, one such useful function is called gather: gather function takes multiple columns and collapses into key-value pairs, this really helps in shaping up the data.For example: let us say you want to compare sales prices of houses in different zip codes.
One of the other important packages is called ggplot2, it is a very important package that helps one to do advanced visualizations, this package relies on the concept of grammar of graphics where the visualizations are built by adding layers to enhance the plots. Please refer to the documentation here:
http://ggplot2.org/
The session on R was very informative and there was a demo on how to determine the sale price of a house that is 2500 sqaure foot in a particular zip code.
The next session i attended was on PowerBI architecture, implementation and usage. Melissa Coates, a SQL Server BI Professional/Expert provided an excellent overview of the PowerBI architecture and how the product has evovled with different features available in the On-Premise/Desktop and the cloud versions. There were really neat features that were demonstrated and how the reports can be shared within the organization/group of users. There are a lot of options available within the product that can be leveraged very effectively within the organization..
The session on Data Mining in SSAS was very effectively presented by Mark Hudson , Data Analytics/Data Mining expert from Captech. The terminology related to data mining was clearly explained to the audience so that we could take forward the concepts into the actual data mining models. The concepts related to continuous and discrete variables, does cor-related variables really cause causation were effectively discussed. Predictive modeling/Data Mining aim to produce predictions and not guarantee's. Next a baseball data set that pretty sizeable was used to demonstrate the data mining models. Here the data mining model was built directly using a query on a relational table in sql server database. One of the requirements for Data mining models is that there has to be a unique key per table, no composite keys allowed. He used the baseball data in a table as a source for the data mining models. For the demo he touched upon Decision Tree, Clustering and Naive Bayes algorithms. Currently SSAS data mining comes with 9 algorithms and is available in MultiDimensional SSAS only. Once the data is pulled into a data source view, the mining structure is built based on the columns pulled in and the attribute that needs to be predicted is selected along with other input variables. The variables that are not needed for the models can be removed at this stage. Once these were completed 3 mining models were built based on the algorithms (Decision Tree, Clustering and Naive Bayes) and executed. Once the models were built the results can be analyzed in the Mining Model viewer within SSAS and those can be used to validate the data set. The difference between SSAS and R is that while SSAS is more graphical and UI driven, R Language provides more control on how the models can be constructed from ground up and does involve more coding.
Overall the event was a great success in terms of learning, sharing and meeting with other SQL Server Experts.
Wednesday, April 23, 2014
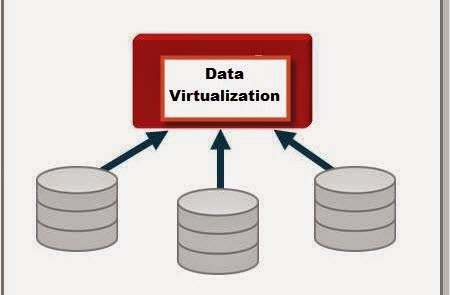
Data Virtualization...
With companies/business having different types of data marts/datawarehouses there is a fear that these could become independent silos and could not provide value to the business as a whole. There has been lot of resources(Time,Money,People) being invested in building a datawarehouse/data marts. The business would like to get value from the disparate datawarehouses/data marts, so the concept that has been in play for quite a while is Data Virtualization. Data Virtualization could be defined as process of building a agile data layer for easy data access and delivery. This is also sometimes referred to as the data abstraction layer so that users can get access to data quickly. Having defined Data Virtualization, where does one use this concept: Here are some of the situations where Data Virtualization could be used.
1. Data Federation - Scenario: A application requires data from multiple incompatible data sources.
(Example: Federated Views, Virtual Data Marts)
2. Data Warehouse Extension: The Datawarehouse does not contain the required data to create reports (Example: Datewarehouse Extension)
3. Data Virtualization - Build a Agile Data layer for easy data access.
4. Big Data Integration: How to combine Big Data with traditional data for analysis (Example: Hadoop)
5. Cloud Data Integration: Need to integrate systems on site with the Applications running in the cloud (Example: SaaS Application Integration)
 Based on the scenario and type of question we are trying to answer, Data Virtualization could be a solution. The concepts described here were based on a article related to the Composite , a data virtualization/Integration tool from Cisco (http://www.compositesw.com/data-virtualization/).
1. Data Federation - Scenario: A application requires data from multiple incompatible data sources.
(Example: Federated Views, Virtual Data Marts)
2. Data Warehouse Extension: The Datawarehouse does not contain the required data to create reports (Example: Datewarehouse Extension)
3. Data Virtualization - Build a Agile Data layer for easy data access.
4. Big Data Integration: How to combine Big Data with traditional data for analysis (Example: Hadoop)
5. Cloud Data Integration: Need to integrate systems on site with the Applications running in the cloud (Example: SaaS Application Integration)
Tuesday, December 4, 2012
Data Abstraction-Data Integration
In my earlier blog post I discussed about data integration and how it can provide unified view of disparate data sources. In today's world of data warehousing/data analytics it is becoming increasingly common to have disparate data sources and there are lots of ETL projects which are aimed at consolidating the data into data marts and data warehouses. In today's blog post I would like to introduce a new product called Composite Software which helps in Data Integration and Provides Data Abstraction. It helps the business to perform Data Virtualization. This provides the business with following benefits:
•Simplify information access – Bridge business and IT terminology and technology so both can succeed.
•Common business view of the data – Gain agility, efficiency and reuse across applications via an enterprise information model or “Canonical” model.
•More accurate data –Consistently apply data quality and validation rules across all data sources.
•More secure data – Consistently apply data security rules across all data sources and consumers via a unified security framework.
•End-to-end control – Use a data virtualization platform to consistently manage data access and delivery across multiple sources and consumers.
•Business and IT change insulation –Insulate consuming applications from changes in the source and vice versa. Business users and applications developers work with a more stable view of the data. IT can make ongoing changes and relocation of physical data sources without impacting information users.
Please use the following link to know more about the software:
http://www.compositesw.com/data-virtualization/data-abstraction/
The developers can work with the Composite Studio to develop the views which would be sourced from different data sources. In a nutshell Composite software is a good tool for perform Data integration and Data Abstraction.
Friday, November 16, 2012
Data Integration & Virtualization...
In today's BI world there is data pulled from variety of Data sources. Once the data is pulled from the source they need to housed is what is called a Operational Data Store. Once data is housed here , then data is transformed/modelled for different reporting and analytical purposes. One of the key points to be considered is the cost of storage and the support personnel needed to maintain these data stores. The ETL's to perform such pulls can also be very complicated in certain cases. In the recent times the concept of Data Integration and federation has evolved and is being experimented in Master data management. One of the frequent requirement today in the business world today is that there is a need for a unified view of disparate data sources. Currently this requirement is being handled by an ETL Based approach and building data warehouses on top of them, at the same time tying disparate data sources together can be a challenging process. This is where the concept of data integration architecture kicks in, one can look at the following link to get an overview of data integration and data reingetration methodology:
http://www.strins.com/integrated-data-warehouse.html
This is an area to watch out for in the coming years as more and more disparate data sources are being used for data analysis.
http://www.strins.com/integrated-data-warehouse.html
This is an area to watch out for in the coming years as more and more disparate data sources are being used for data analysis.
Subscribe to:
Comments (Atom)