In today's world of ever growing data and information, one of the areas that has been kind of battling the existence has been data modeling, there are wide ranging opinions about the validity of data modeling both positive and negative. One of the viewpoints favoring data modeling has been to provide a context around the data that needs to be accessed and used, how it can be stored and resented to users. There are number of situations where how the data being organized has to be presented to the business in a concise fashion. There are different types of models within data modeling like conceptual models, logical models and physical models. What do these type of mean and how they differ from each other is very concisely presented in the article below. Quoting from the article: "My uses of conceptual, logical, and physical come from the Information Engineering (IE) methods of data modeling". The article has been written Karen Lopez: Senior Project Manager and Principal Consultant, InfoAdvisors, Inc.
http://www.datamodel.com/index.php/articles/what-are-conceptual-logical-and-physical-data-models/
I hope the above article provides good explanation especially for folks who are getting into the area of data modeling.
Wednesday, March 30, 2016


Tuesday, March 22, 2016
Data Science Resource/Blog...
One of the rapidly advancing areas today is Data Analytics/Data Science in the Business Intelligence space. There are lot of resources/tools that are coming explaining the capabilities of Data Science. Data Science has seen tremendous growth alongside the adoption of Big Data technologies. It is a very challenging space to keep up with, one of the blogs that i regularly visit to understand the concepts in Data Science and keep up with the trends in Data Science/Analytics, is http://www.analyticsvidhya.com/. The blog/website is very nicely laid out with content rich articles and tutorials. They cover a variety of tools and also encourage folks interested in data science to participate in challenges/contests. Please do visit the site, it provides amazing content and coverage.
Saturday, March 19, 2016
Experiments - Azure ML Studio
Azure ML studio is very intuitive and a powerful tool that can be used for performing different type of data analysis experiments. The Studio can be used to set up very basic experiments like descriptive statistics to performing complicated machine learning algorithms. The whole layout of the ML studio is very user friendly and in some ways remind me of the layouts in SSIS packages. I decided to setup a basic experiment in ML studio to perform certain descriptive statistics calculations on a sample data set. The dataset I used was adult census data from UCI repository and ran the data set through a R script component to data, once the data was massaged it was run through a descriptive statistics to perform descriptive statistics on each column. Once all the components are in place the experiment can be run in the ML studio to get the results. The data can be verified and if everything looks good, the experiment can be published as a web service and can be accessed by a say .NET program.
I have illustrated the experiment which i have set up in the ML Studio.

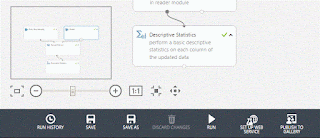
I have illustrated the experiment which i have set up in the ML Studio.


Hope this provides a basic overview of ML Studio. Azure ML studio opens up a lot of possibilities to perform different types of data science experiments and bring them more into the main stream.
Sunday, February 14, 2016
Data Lineage/Data Modeling...
With the advent of visualization and sophisticated reporting tools there is one aspect which is very important for analysis of data. For the reports/visualization to be valid and effective, it is very important to have the data behind the charts /graphs to be properly modeled and validated. When analyst look at the reports, they very soon look at what comprises the data element, where the data is sourced from. The analysts would also be interested in how the data has been transformed by the time it is shown in the reports. In order to have the reports/visualization to be effective it is very important to have a strategy for data lineage/data modeling. Typically data is sourced from various sources and finally they end up in data warehouse/data mart. During this process it very important to track how the data moves from one system to another. It is possible that data elements would move through the process with out any transformation. The other possibilities are that the data element could be transformed like there could be casting/trimming, extraction of a data element into multiple columns in the target data mart. The data elements could become part of a calculation or they could end up being candidates for lookup tables. In order to capture all of the above data movements/transformations, it would be good to have a repository where the Metadata/data lineage can be stored. Such a metadata tool would be very handy for analysts/developers to really understand what makes up the data elements. It can also provide a valid context so that a effective visualization solution can be developed. The other aspect that help provide improved visualizations is also data modeling. Data modeling when done correctly with a proper framework can provide immense benefits to the overall data services visualization strategy. It is extremely important to know the data that is being worked on/extracted. There are products in the market that cover the data lineage piece of the puzzle. Pyramid Analytics, one of the more popular vendors that provide really good analytic tools has come with a product called BI office that has a Governed Data Discovery Platform. Please see the link below for all the details:
http://www.pyramidanalytics.com/pages/bi-office/governed-data-discovery.aspx.
As per the website here is a overview of the Data governance feature in BI Office:
"BI Office provides you with self-service content creation in a centralized, shared paradigm – that also tracks the content life-cycle".
When companies/Business build a data services/data provisioning strategy, data governance needs to be an integral part of the whole vision. As the usage begins to scale and there is more demand for services, data governance becomes more and more critical to make the data services strategy successful.
http://www.pyramidanalytics.com/pages/bi-office/governed-data-discovery.aspx.
As per the website here is a overview of the Data governance feature in BI Office:
"BI Office provides you with self-service content creation in a centralized, shared paradigm – that also tracks the content life-cycle".
When companies/Business build a data services/data provisioning strategy, data governance needs to be an integral part of the whole vision. As the usage begins to scale and there is more demand for services, data governance becomes more and more critical to make the data services strategy successful.
Friday, January 15, 2016
SSRS 2016-New Features...
With a plethora of reporting, data visualization tools ,SSRS was getting buried in the mix. The question was would SSRS 2016 get any major updates or would that kind of go away slowly with other tools taking prominence. The good news is that SSRS 2016 is getting lot of new features, here are some of them: Reporting Services Web Portal: The usual SSRS portal has undergone a major revamp and the portal looks more in tune with the current dash board offerings from other vendors. One of the major change has been the use of HTML 5 in SSRS 2016 which should allow reports to be portable across devices and increase the offering s more effectively. There is also a feature being added called Mobile report Publisher where in you can publish SQL Server mobile reports to your reporting portal. For more detailed explanation of SSRS 2016 features, please refer to the link here below:
https://msdn.microsoft.com/en-us/library/ms170438.aspx
https://msdn.microsoft.com/en-us/library/ms170438.aspx
Thursday, December 31, 2015
Big Data Trends in 2016...
First, I would like to wish the readers of my blog a very happy and prosperous new year 2016. Due to personal challenges i could not post much in 2015, i hope i can do better in 2016. Looking forward to how the year 2016 shapes up for analytics, if there are newer trends or consolidation of big and small technology firms in the analytics space. There were lot of strides made in data science, the programming language R has become increasingly popular across various industry domains, More business folks are beginning to understand the power of good models and how it can be pursued for predictive analytics. There were also strides made in bringing R and SQL Server together, this will be seen more in 2016 as we begin to see more valid business used cases.
Here is a link for the Top Big 3 data trends in 2016.
http://insidebigdata.com/2015/12/29/the-top-3-big-data-trends-of-2016/
Once again wishing everyone a very happy 2016.
Here is a link for the Top Big 3 data trends in 2016.
http://insidebigdata.com/2015/12/29/the-top-3-big-data-trends-of-2016/
Once again wishing everyone a very happy 2016.
Monday, November 16, 2015
Using Data Science Techniques with R- Zillow.com
R language has been gaining increasing popularity as Machine Learning, Predictive analytics take more and more importance within business. The applications of R has been steadily increasing in different industry domains. One of the areas where the R language is being very strongly used is in the are of Real Estate to predict selling prices of Homes Please read the link to blog post below related to how the company Zillow uses R for predicting estimates of prices for houses.
http://www.datanami.com/2015/08/12/inside-the-zestimate-data-science-at-zillow/
As the article indicates they use a mix of tools at different stages of the data value chain. The more cleaner the data is, the better the prediction is going to be.
http://www.datanami.com/2015/08/12/inside-the-zestimate-data-science-at-zillow/
As the article indicates they use a mix of tools at different stages of the data value chain. The more cleaner the data is, the better the prediction is going to be.
Subscribe to:
Posts (Atom)